SIF Trading Predictions
1 Day Prediction
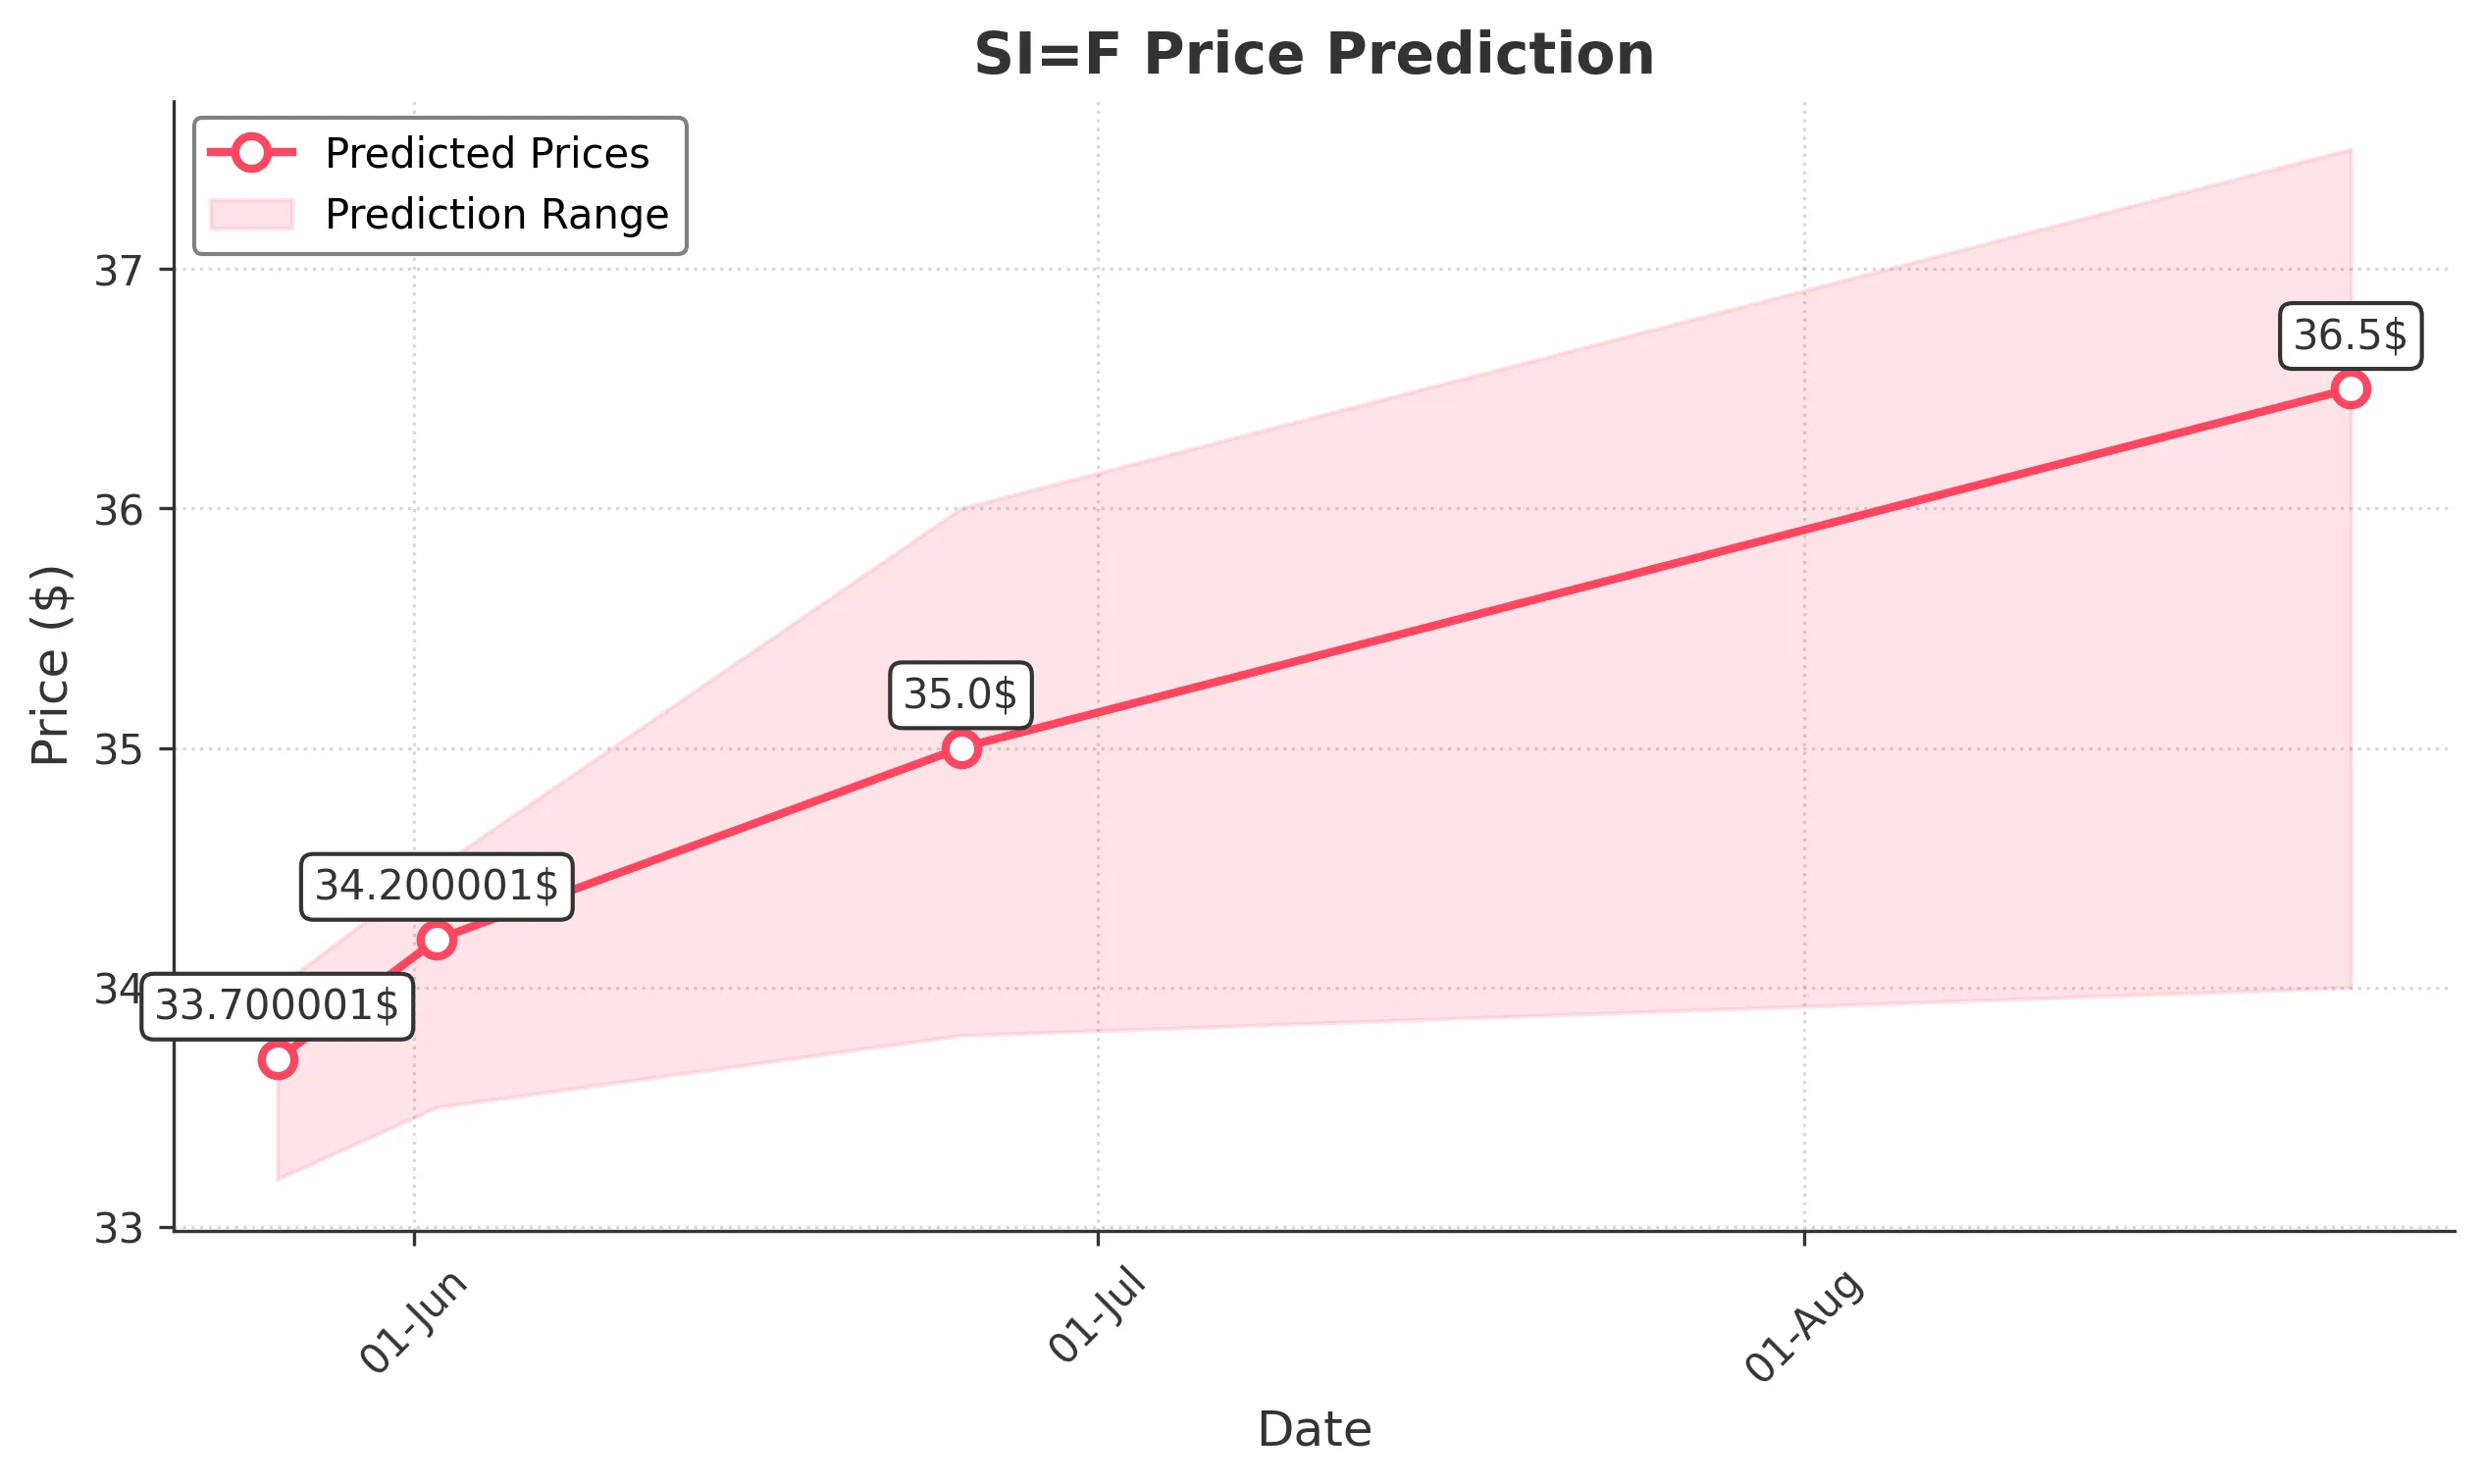
Target: May 26, 2025$33.700001
$33.6
$34
$33.200001
Description
The stock shows bullish momentum with a recent upward trend. The RSI is approaching overbought levels, indicating potential for a pullback. However, the MACD remains positive, suggesting continued upward movement. Volume is stable, supporting the price action.
Analysis
Over the past 3 months, SI=F has shown a bullish trend with significant support around 32.00 and resistance near 34.00. The MACD indicates upward momentum, while the RSI is approaching overbought territory. Volume has been consistent, with some spikes indicating interest. Recent candlestick patterns suggest bullish sentiment, but caution is warranted due to potential market corrections.
Confidence Level
Potential Risks
Potential market volatility and external news could impact the price. RSI nearing overbought may lead to a short-term correction.
1 Week Prediction
Target: June 2, 2025$34.200001
$34
$34.5
$33.5
Description
The stock is expected to continue its upward trajectory, supported by strong bullish signals from the MACD and a stable RSI. However, the proximity to resistance levels may limit upside potential. Volume trends indicate sustained interest.
Analysis
The stock has maintained a bullish trend with key support at 32.00 and resistance at 34.50. The MACD is bullish, and the RSI is stable, indicating potential for further gains. Volume patterns show consistent buying interest, but caution is advised as the stock approaches resistance levels.
Confidence Level
Potential Risks
Resistance at 34.50 could trigger profit-taking, and any negative news could reverse the trend.
1 Month Prediction
Target: June 25, 2025$35
$34.5
$36
$33.8
Description
The stock is projected to reach new highs as bullish momentum continues. The MACD remains strong, and the RSI is expected to stabilize after a potential pullback. Volume is likely to increase as the stock approaches key resistance levels.
Analysis
SI=F has shown a strong upward trend with significant support at 32.00 and resistance at 36.00. The MACD indicates bullish momentum, while the RSI suggests potential overbought conditions. Volume trends are positive, but external factors could introduce volatility.
Confidence Level
Potential Risks
Market corrections or negative macroeconomic news could impact the bullish outlook.
3 Months Prediction
Target: August 25, 2025$36.5
$35.5
$37.5
$34
Description
The stock is expected to maintain an upward trend, driven by strong fundamentals and market sentiment. The MACD remains bullish, and the RSI is likely to stabilize. However, potential market corrections could create volatility.
Analysis
Over the past three months, SI=F has demonstrated a bullish trend with key support at 32.00 and resistance at 37.00. The MACD indicates continued upward momentum, while the RSI suggests potential overbought conditions. Volume patterns show consistent interest, but external factors could introduce volatility.
Confidence Level
Potential Risks
Unforeseen macroeconomic events or shifts in market sentiment could lead to price corrections.