SIF Trading Predictions
1 Day Prediction
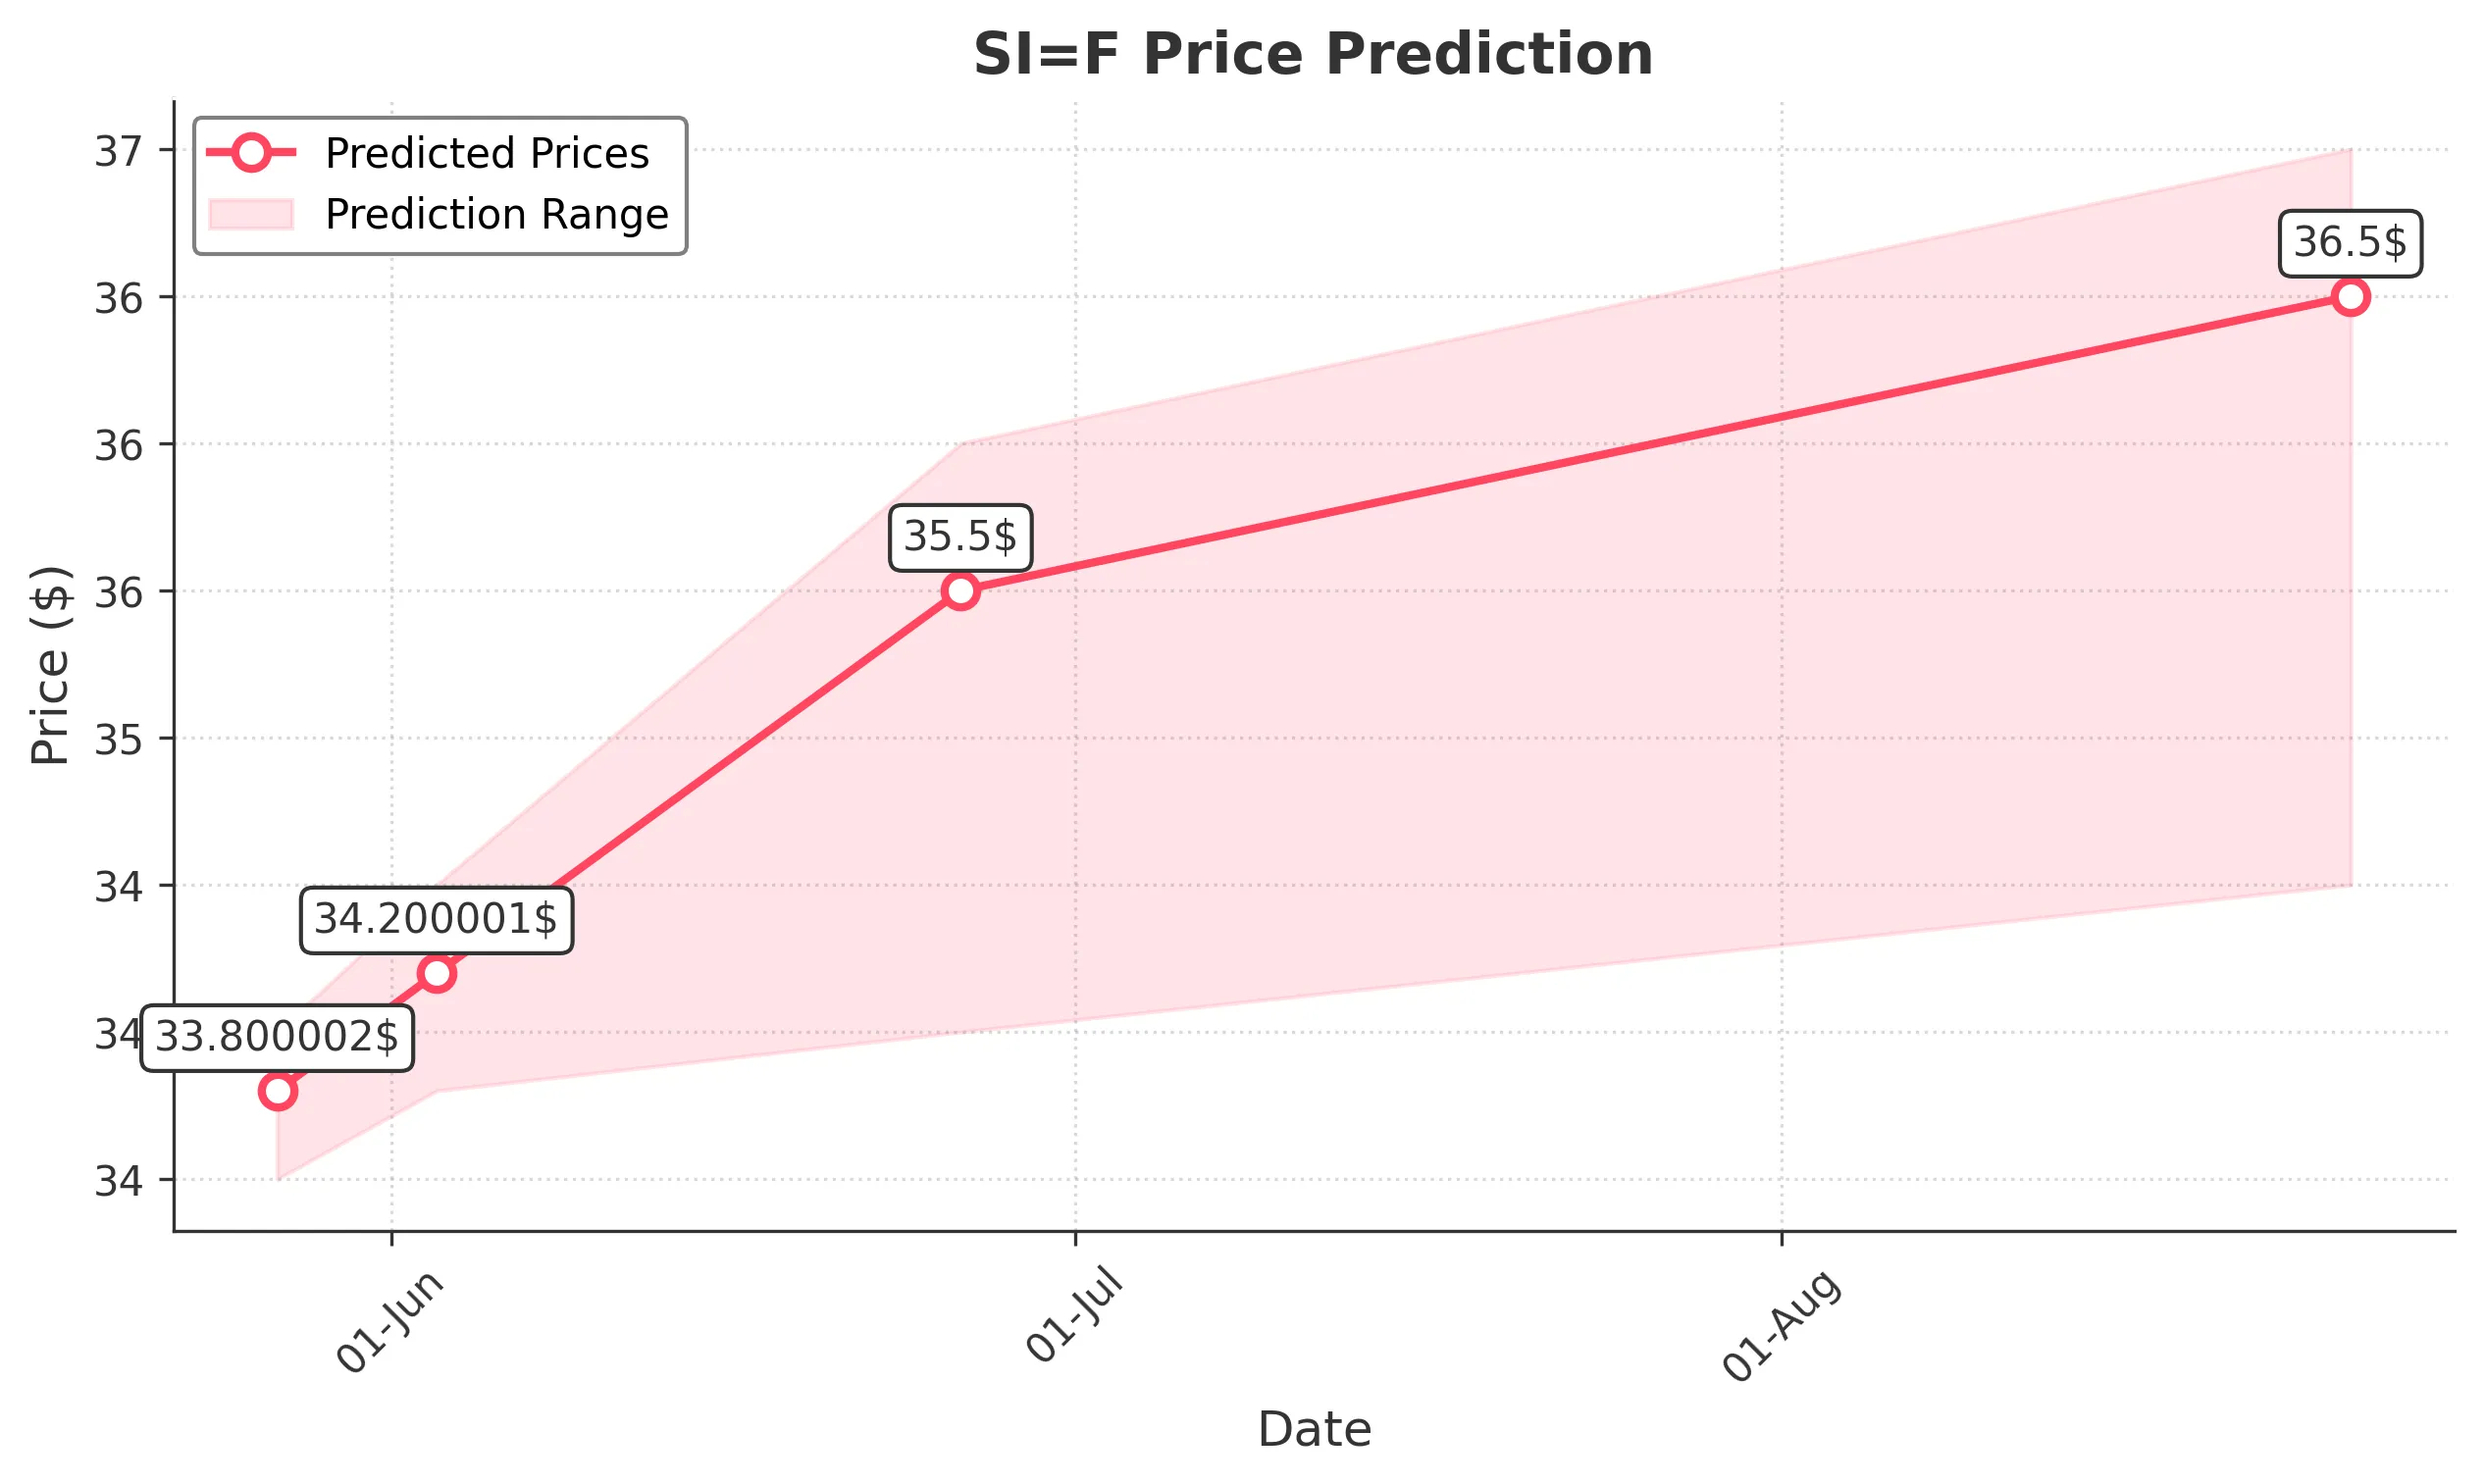
Target: May 27, 2025$33.800002
$33.650002
$34
$33.5
Description
The stock shows bullish momentum with a recent upward trend. The RSI is approaching overbought levels, indicating potential for a pullback. However, the MACD is positive, suggesting continued upward movement. Volume is expected to increase slightly.
Analysis
Over the past 3 months, SI=F has shown a bullish trend with significant support at 32.00 and resistance around 34.00. The MACD indicates upward momentum, while the RSI is nearing overbought territory. Recent volume spikes suggest increased interest, but caution is warranted.
Confidence Level
Potential Risks
Potential for a short-term pullback due to overbought RSI conditions.
1 Week Prediction
Target: June 3, 2025$34.200001
$33.800002
$34.5
$33.8
Description
The stock is expected to continue its upward trajectory, supported by strong bullish sentiment and positive technical indicators. The MACD remains bullish, and the price is likely to test resistance at 34.50. Volume may increase as traders react to the trend.
Analysis
The stock has maintained a bullish trend with key support at 32.00 and resistance at 34.50. The MACD and moving averages support upward movement, but the RSI indicates potential overbought conditions. Volume patterns suggest increased trading activity, indicating strong interest.
Confidence Level
Potential Risks
Market volatility and potential profit-taking could lead to fluctuations.
1 Month Prediction
Target: June 26, 2025$35.5
$34.200001
$36
$34
Description
The stock is projected to reach new highs as bullish momentum persists. The MACD remains positive, and the price may break through resistance levels. However, the RSI indicates potential overbought conditions, suggesting caution for traders.
Analysis
SI=F has shown a strong upward trend with significant resistance at 35.00. The MACD and moving averages indicate bullish momentum, but the RSI suggests caution due to overbought conditions. Volume trends indicate strong interest, but external factors could introduce volatility.
Confidence Level
Potential Risks
External market factors and economic data releases could impact performance.
3 Months Prediction
Target: August 26, 2025$36.5
$35.5
$37
$34.5
Description
The stock is expected to maintain an upward trend, potentially reaching new highs. The technical indicators support bullish sentiment, but the RSI may indicate overbought conditions. Market sentiment and macroeconomic factors will play a crucial role.
Analysis
Over the past three months, SI=F has shown a strong bullish trend with key support at 34.00 and resistance at 36.00. The MACD and moving averages indicate continued upward momentum, but the RSI suggests caution. Volume patterns indicate strong interest, but external factors could introduce uncertainty.
Confidence Level
Potential Risks
Unforeseen economic events or market corrections could lead to volatility.