SIF Trading Predictions
1 Day Prediction
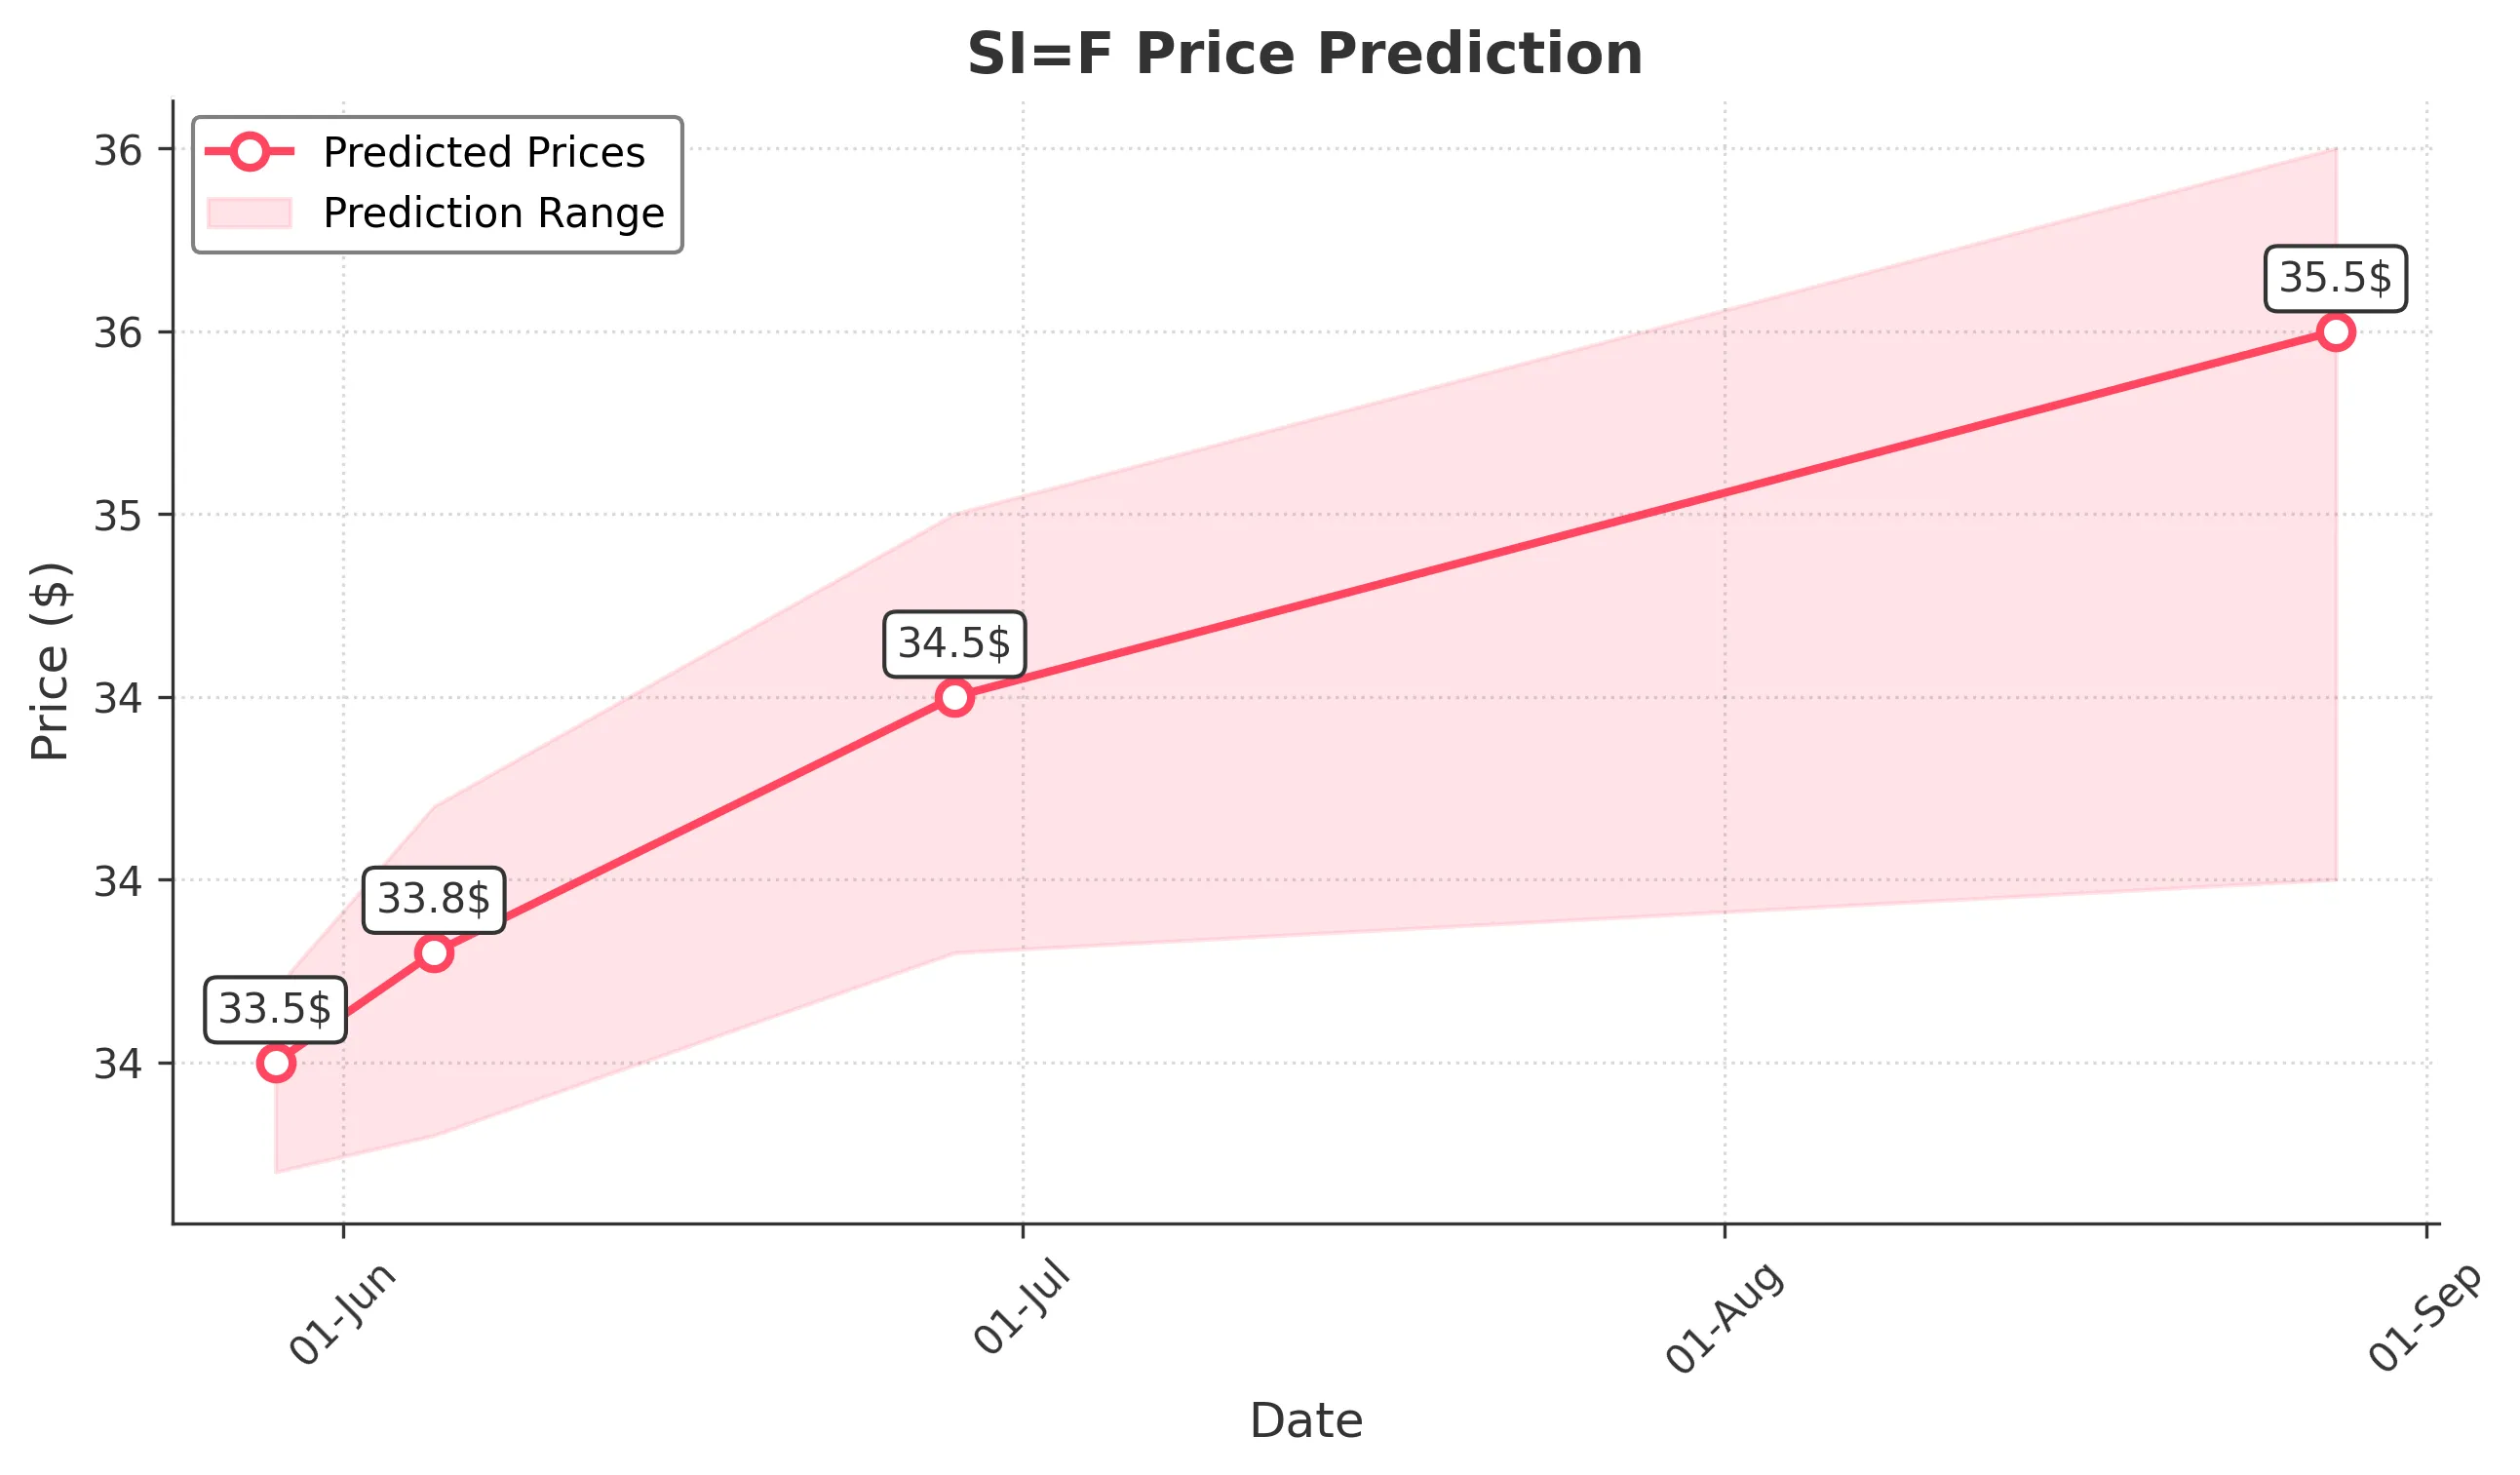
Target: May 29, 2025$33.5
$33.4
$33.7
$33.2
Description
The stock shows a bullish trend with a recent upward movement. The RSI is approaching overbought levels, indicating potential for a pullback. However, the MACD remains positive, suggesting continued upward momentum. Volume is expected to increase slightly.
Analysis
Over the past 3 months, SI=F has shown a bullish trend with significant support at $32.00 and resistance around $34.00. The recent price action indicates a strong upward movement, but the RSI nearing overbought levels suggests caution. Volume has been stable, with occasional spikes indicating interest.
Confidence Level
Potential Risks
Potential market volatility and profit-taking could lead to a price pullback.
1 Week Prediction
Target: June 5, 2025$33.8
$33.6
$34.2
$33.3
Description
The stock is expected to continue its upward trajectory, supported by positive MACD and bullish candlestick patterns. However, the RSI indicates potential overbought conditions, which may lead to short-term corrections. Volume is likely to remain steady.
Analysis
The stock has been in a bullish phase, with key support at $32.00 and resistance at $34.00. The MACD is bullish, and the recent candlestick patterns suggest continued upward momentum. However, the RSI indicates potential overbought conditions, warranting caution.
Confidence Level
Potential Risks
Market sentiment could shift due to external factors, impacting the stock's performance.
1 Month Prediction
Target: June 28, 2025$34.5
$34.2
$35
$33.8
Description
The stock is projected to reach higher levels as bullish momentum persists. The MACD remains positive, and the price is expected to test resistance levels. However, the RSI suggests caution as it approaches overbought territory.
Analysis
SI=F has shown a strong bullish trend with significant support at $32.00 and resistance at $34.00. The MACD is positive, indicating upward momentum, but the RSI nearing overbought levels suggests potential corrections. Volume patterns indicate steady interest.
Confidence Level
Potential Risks
Unforeseen macroeconomic events could impact market sentiment and stock performance.
3 Months Prediction
Target: August 28, 2025$35.5
$35
$36
$34
Description
The stock is expected to maintain an upward trend, driven by strong market sentiment and positive technical indicators. However, potential resistance at $36.00 may lead to volatility. The RSI indicates a need for caution as it approaches overbought levels.
Analysis
Over the past three months, SI=F has demonstrated a bullish trend with key support at $32.00 and resistance at $36.00. The MACD remains positive, but the RSI suggests caution as it approaches overbought territory. Volume patterns indicate consistent interest, but external factors could introduce volatility.
Confidence Level
Potential Risks
Market corrections and external economic factors could lead to unexpected price movements.