SIF Trading Predictions
1 Day Prediction
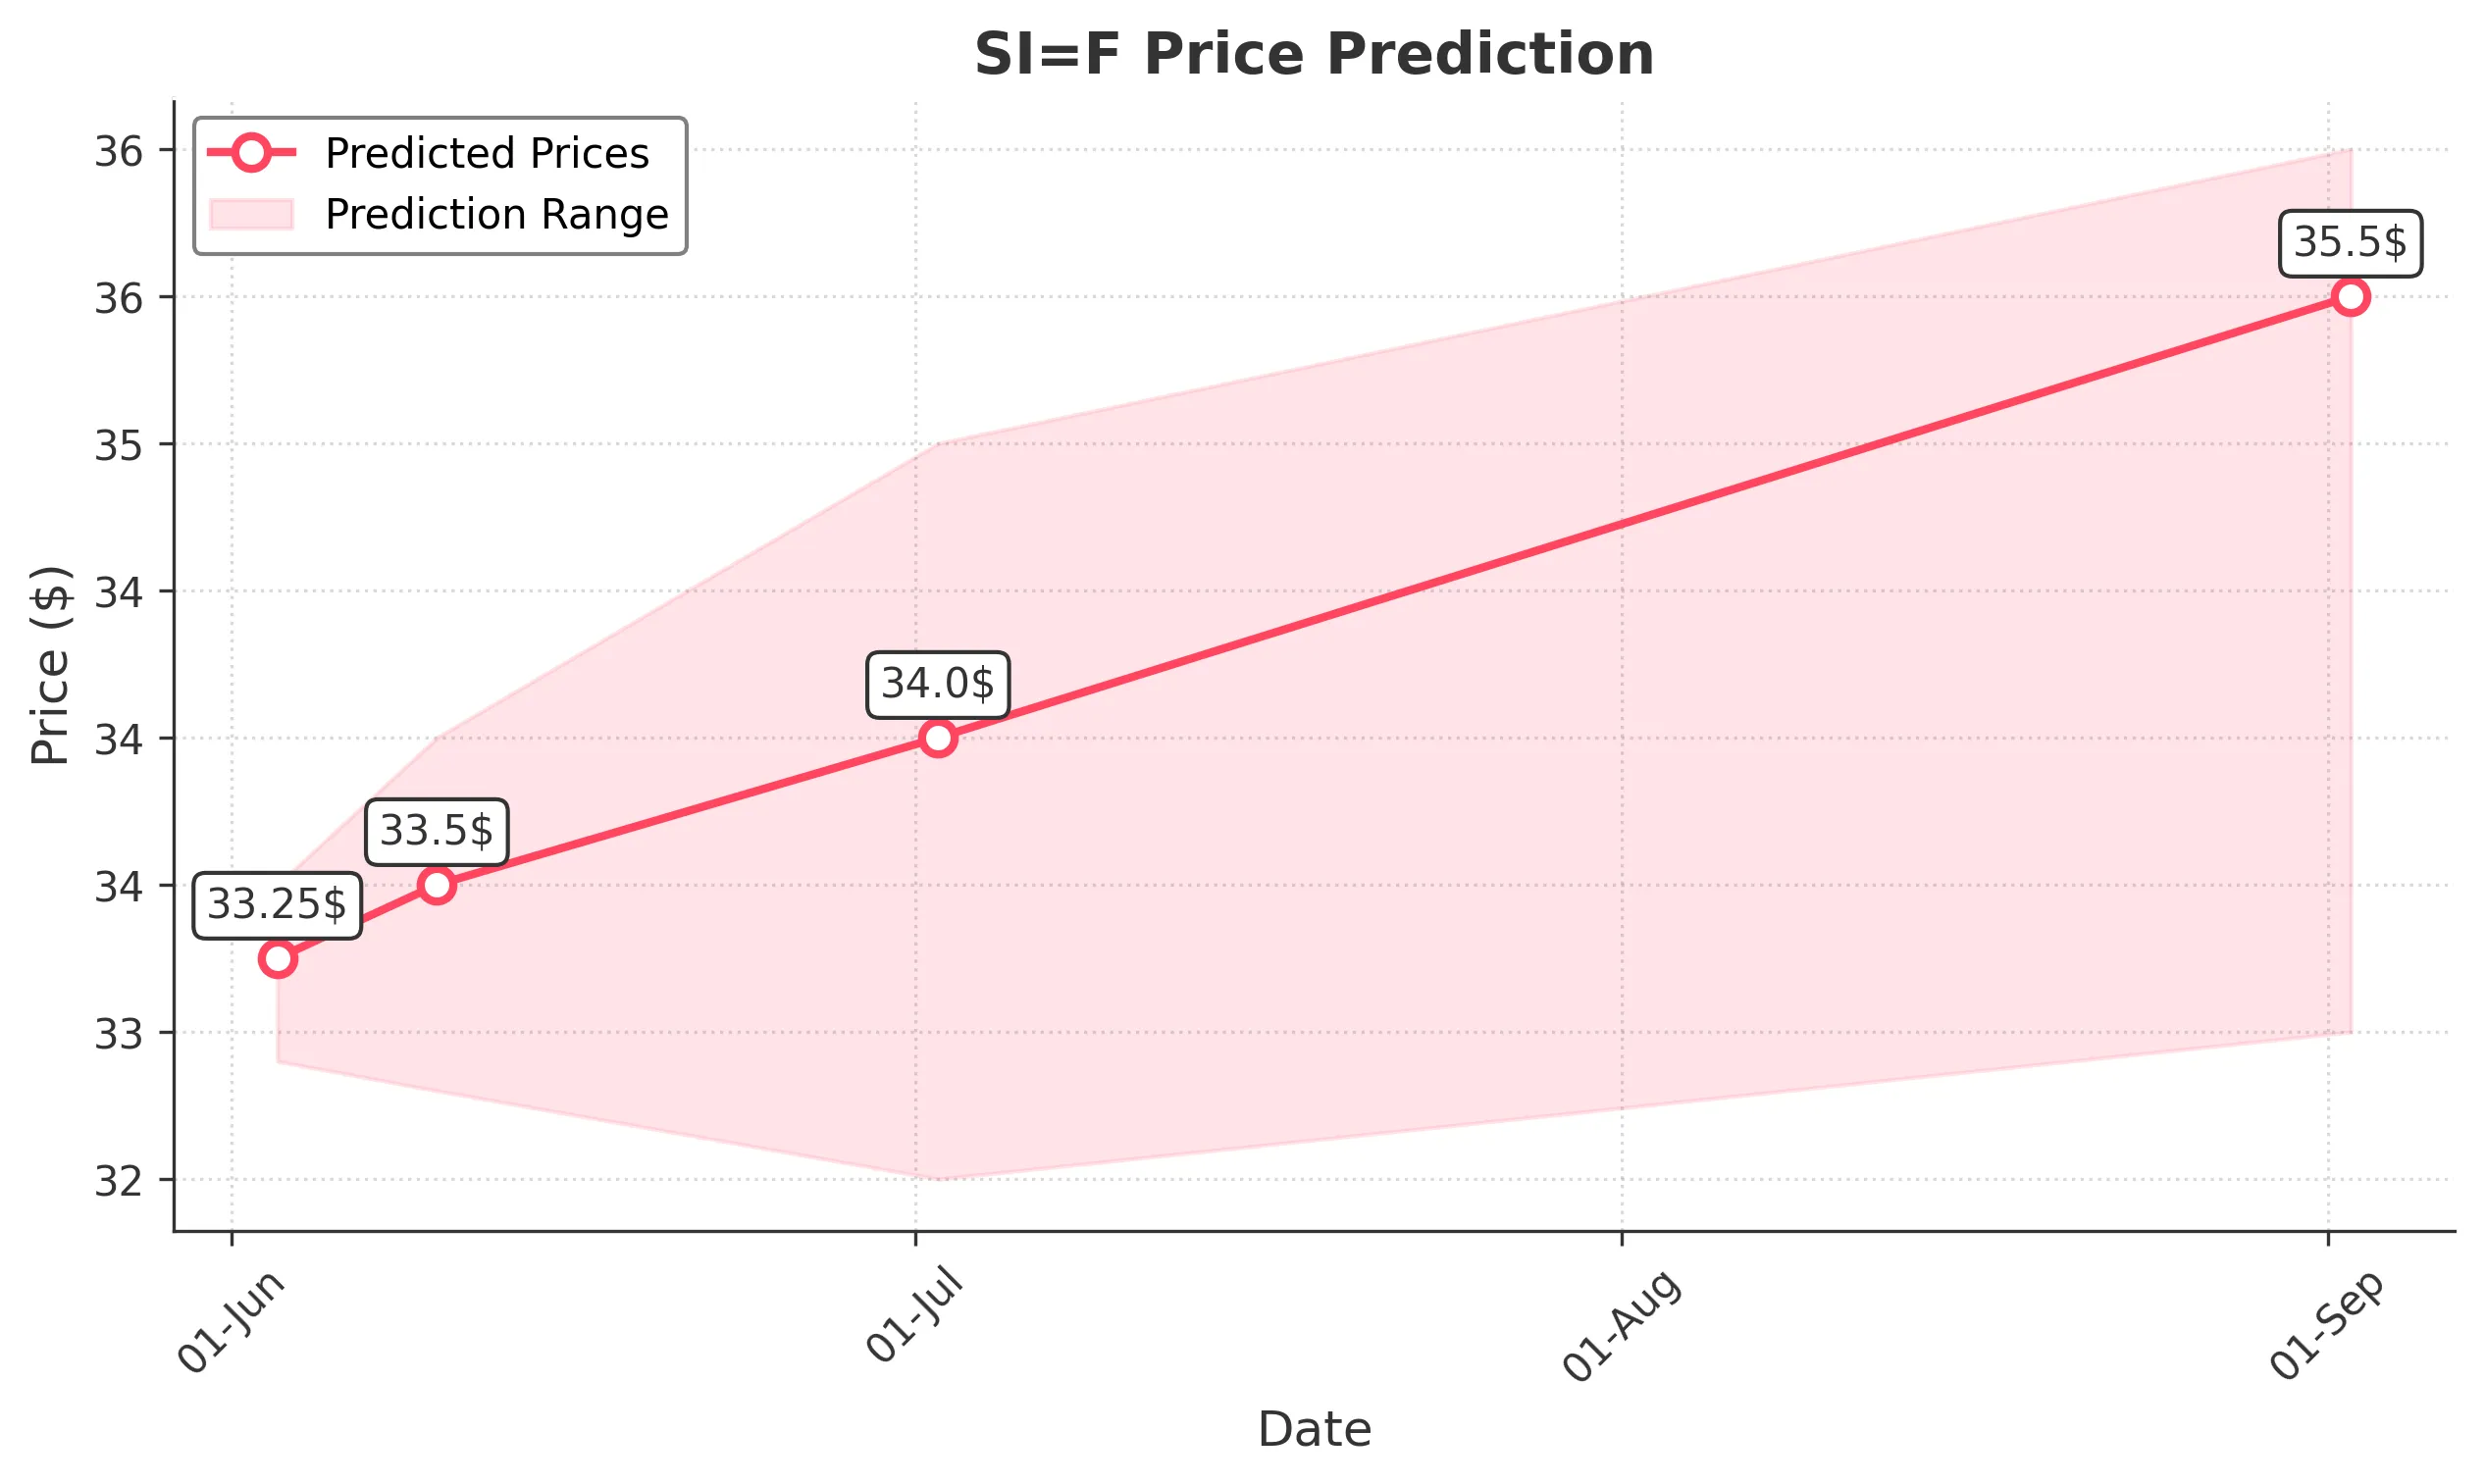
Target: June 3, 2025$33.25
$33.2
$33.5
$32.9
Description
The stock shows a bullish trend with a recent upward movement. The RSI is approaching overbought levels, indicating potential for a pullback. However, the MACD remains positive, suggesting continued upward momentum. Volume is expected to increase as traders react to recent price action.
Analysis
Over the past 3 months, SI=F has shown a bullish trend with significant support at $32.00 and resistance around $34.00. The recent price action indicates a recovery from a dip, with the MACD indicating bullish momentum. Volume has been relatively stable, with some spikes indicating increased interest.
Confidence Level
Potential Risks
Potential market volatility and external news could impact the price unexpectedly.
1 Week Prediction
Target: June 10, 2025$33.5
$33.3
$34
$32.8
Description
The stock is expected to maintain its upward trajectory, supported by recent bullish candlestick patterns. The Bollinger Bands indicate potential for price expansion. However, the RSI suggests caution as it approaches overbought territory, which could lead to a short-term pullback.
Analysis
The stock has been in a bullish phase, with key support at $32.00 and resistance at $34.00. The MACD is positive, and the RSI is nearing overbought levels, indicating a potential correction. Volume patterns show increased interest, but external factors could introduce volatility.
Confidence Level
Potential Risks
Market sentiment could shift due to macroeconomic factors, affecting the stock's performance.
1 Month Prediction
Target: July 2, 2025$34
$33.8
$35
$32.5
Description
The stock is likely to continue its upward trend, supported by strong technical indicators. The Fibonacci retracement levels suggest a target around $34.00. However, the RSI indicates potential overbought conditions, which could lead to a correction.
Analysis
SI=F has shown a strong bullish trend, with significant resistance at $34.00. The MACD remains positive, and volume has been increasing, indicating strong buying interest. However, the RSI nearing overbought levels suggests caution, as a pullback could occur.
Confidence Level
Potential Risks
Unforeseen market events or economic data releases could impact the stock's trajectory.
3 Months Prediction
Target: September 2, 2025$35.5
$34.8
$36
$33
Description
The stock is expected to reach new highs, driven by positive market sentiment and strong technical indicators. The MACD and moving averages suggest a continuation of the bullish trend. However, potential market corrections should be monitored.
Analysis
Over the past three months, SI=F has shown a strong bullish trend, with key support at $32.00 and resistance at $34.00. The MACD is positive, and volume patterns indicate strong buying interest. However, external economic factors could introduce volatility, necessitating caution.
Confidence Level
Potential Risks
Long-term predictions are subject to greater uncertainty due to potential market shifts and economic changes.