SIF Trading Predictions
1 Day Prediction
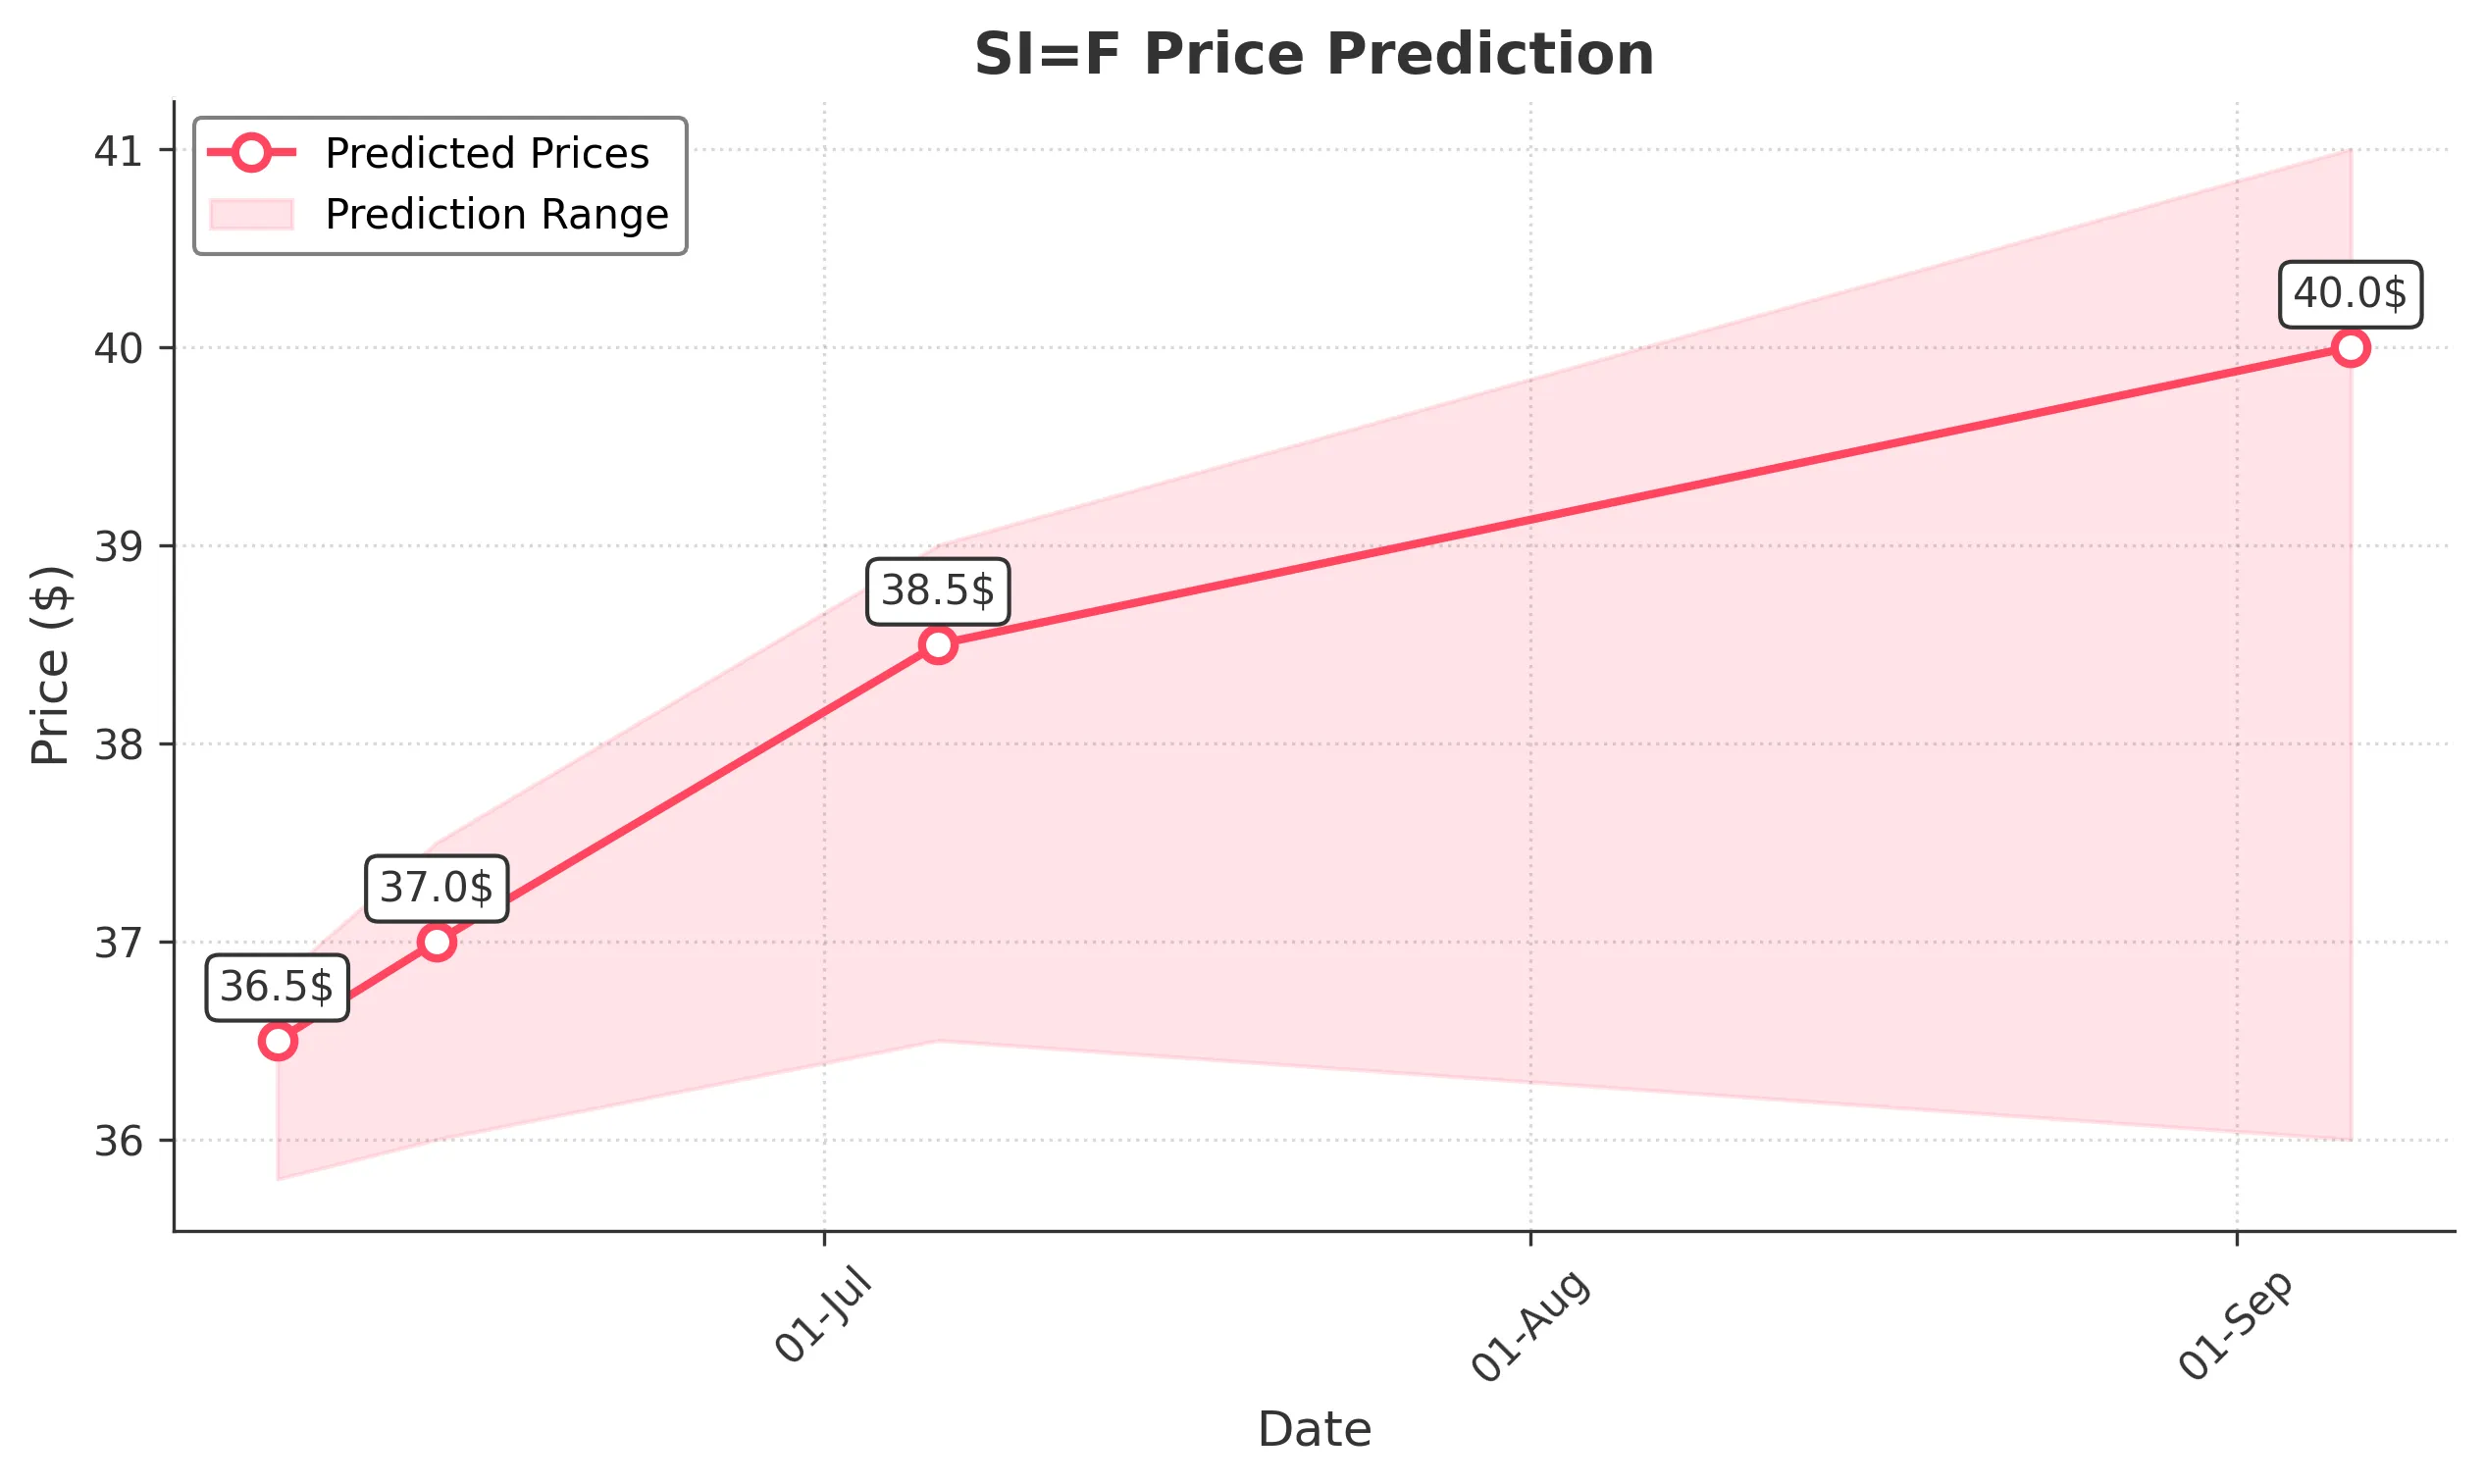
Target: June 7, 2025$36.5
$36.2
$36.8
$35.8
Description
The stock shows bullish momentum with a recent close at 36.195. The RSI is approaching overbought levels, indicating potential upward pressure. MACD is positive, and the price is above the 20-day moving average, suggesting a continuation of the trend.
Analysis
Over the past 3 months, SI=F has shown a bullish trend, especially in the last few weeks. Key resistance is around 36.800, while support is at 34.500. Volume has been increasing, indicating strong interest. The recent price action suggests a continuation of upward momentum.
Confidence Level
Potential Risks
Potential market corrections or profit-taking could impact the price. Watch for any bearish candlestick patterns.
1 Week Prediction
Target: June 14, 2025$37
$36.8
$37.5
$36
Description
The stock is expected to continue its upward trajectory, supported by strong bullish indicators. The MACD remains positive, and the price is likely to test the next resistance level at 37.500. However, watch for potential pullbacks.
Analysis
The stock has been in a strong uptrend, with significant support at 34.500. The recent increase in volume suggests strong buying interest. However, the RSI indicates overbought conditions, which could lead to short-term corrections.
Confidence Level
Potential Risks
Market volatility and external economic factors could lead to unexpected price movements. A reversal pattern could emerge if the price fails to break resistance.
1 Month Prediction
Target: July 6, 2025$38.5
$37
$39
$36.5
Description
The bullish trend is expected to persist, with the stock likely reaching 38.500. The MACD and moving averages support this upward movement, but caution is advised as the RSI may indicate overbought conditions.
Analysis
The stock has shown a consistent upward trend, with key resistance at 39.000. The volume patterns indicate strong buying interest, but the overbought RSI suggests potential corrections. Market sentiment remains bullish, but external factors could introduce volatility.
Confidence Level
Potential Risks
Economic data releases and geopolitical events could impact market sentiment. A significant drop in volume could signal weakening momentum.
3 Months Prediction
Target: September 6, 2025$40
$39
$41
$36
Description
Long-term bullish sentiment is expected to drive the stock towards 40.000. The technical indicators suggest a strong uptrend, but potential market corrections should be monitored closely.
Analysis
The stock has shown a strong bullish trend over the past three months, with key support at 36.000. The MACD and moving averages indicate continued upward momentum, but the market's overall sentiment and external economic conditions could introduce volatility.
Confidence Level
Potential Risks
Long-term predictions are subject to greater uncertainty due to macroeconomic factors and potential market corrections. A shift in market sentiment could lead to significant price adjustments.