SIF Trading Predictions
1 Day Prediction
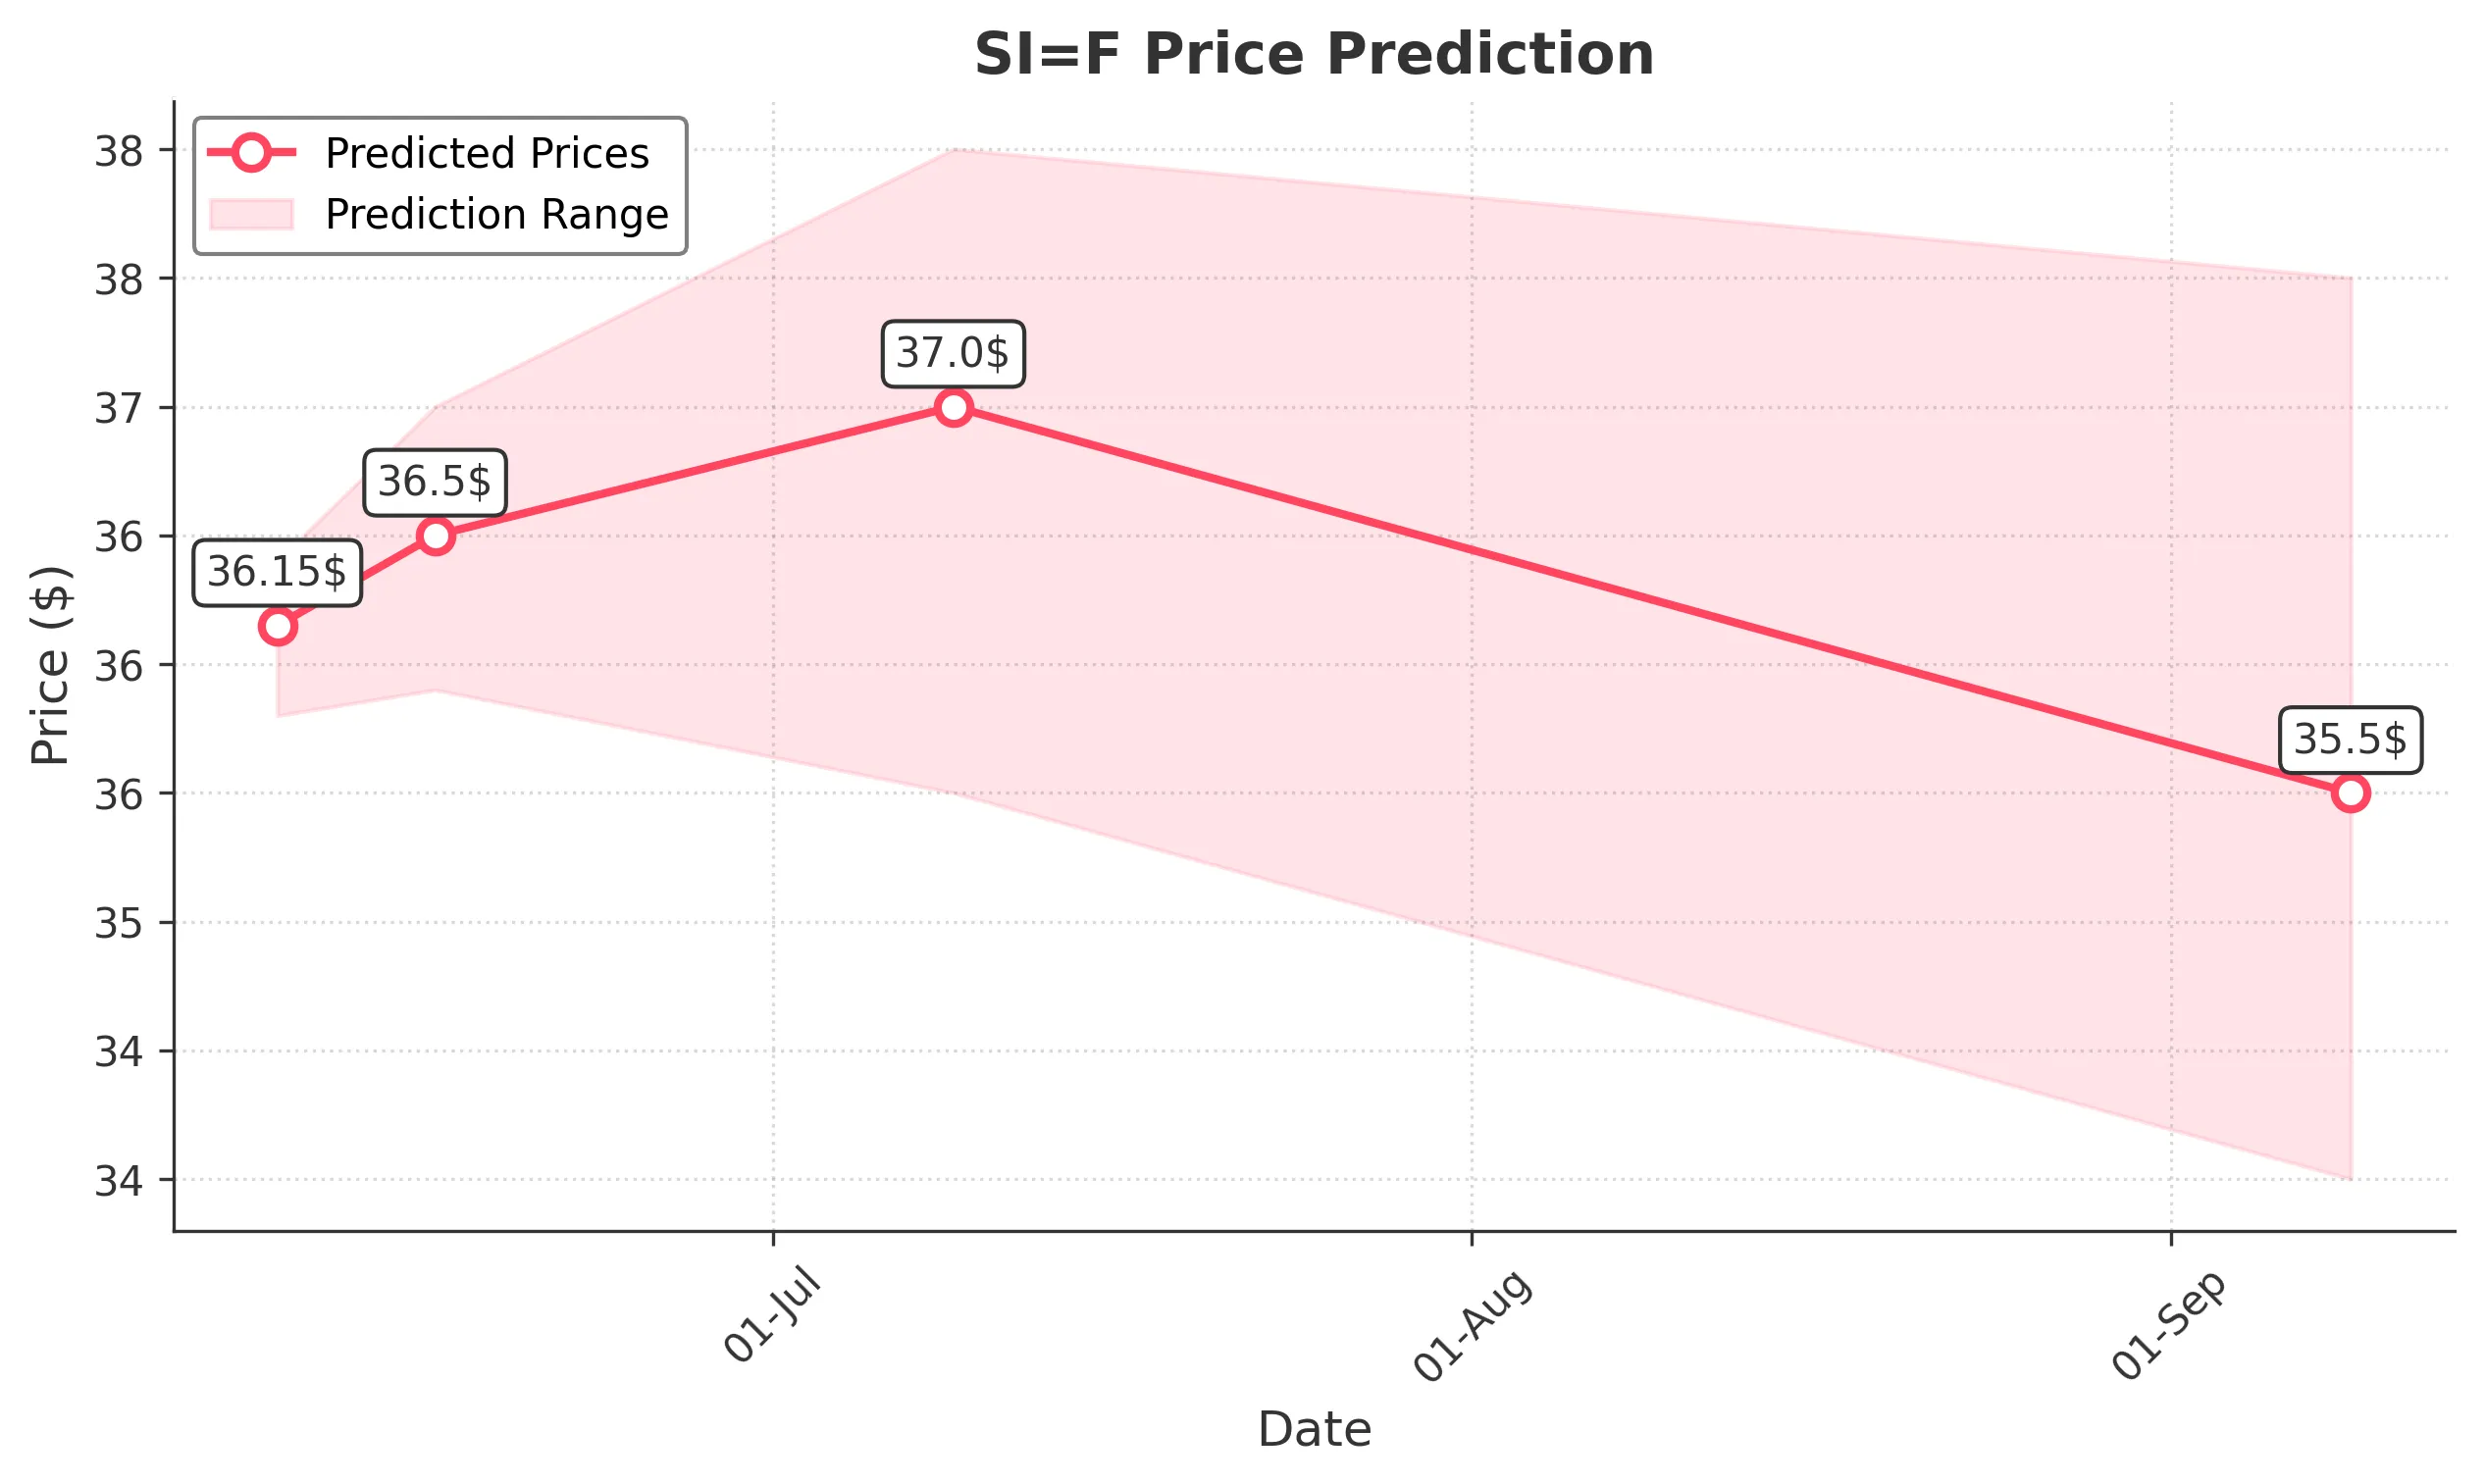
Target: June 9, 2025$36.15
$36.1
$36.4
$35.8
Description
The stock shows bullish momentum with a recent upward trend. The RSI is nearing overbought levels, indicating potential for a pullback. However, MACD remains positive, suggesting continued upward movement. Volume is low, which may limit volatility.
Analysis
Over the past 3 months, SI=F has shown a bullish trend, especially in the last month. Key resistance is around 36.25, while support is at 34.50. The MACD and moving averages indicate upward momentum, but recent high volumes suggest caution.
Confidence Level
Potential Risks
Potential for a pullback due to overbought RSI conditions. Market sentiment could shift quickly.
1 Week Prediction
Target: June 16, 2025$36.5
$36.3
$37
$35.9
Description
The stock is expected to continue its upward trajectory, supported by strong bullish patterns and positive MACD. However, the RSI indicates overbought conditions, which could lead to a correction. Watch for volume spikes as a signal.
Analysis
The stock has been in a bullish phase, with significant resistance at 37.00. The recent price action shows strong buying interest, but the overbought RSI suggests caution. Volume patterns indicate potential for increased activity.
Confidence Level
Potential Risks
High RSI may lead to a correction. Market volatility and external news could impact performance.
1 Month Prediction
Target: July 9, 2025$37
$36.8
$38
$35.5
Description
The stock is likely to reach new highs, driven by bullish sentiment and strong technical indicators. However, the potential for a pullback exists if the RSI remains overbought. Watch for market sentiment shifts.
Analysis
The stock has shown a strong upward trend, with key resistance at 38.00. The MACD and moving averages support bullish momentum, but the overbought RSI raises concerns about sustainability. Volume trends suggest potential for increased trading activity.
Confidence Level
Potential Risks
Market corrections could occur if profit-taking happens. External economic factors may also influence price.
3 Months Prediction
Target: September 9, 2025$35.5
$36
$37.5
$34
Description
Expect a potential correction as the stock may face resistance at higher levels. The RSI indicates overbought conditions, and profit-taking could lead to a decline. Monitor for changes in market sentiment.
Analysis
The stock has been bullish, but signs of a potential reversal are emerging. Key support is at 34.00, while resistance is at 37.50. The MACD shows signs of weakening momentum, and volume patterns suggest caution as profit-taking may occur.
Confidence Level
Potential Risks
Uncertainty in market conditions and potential economic downturns could impact stock performance significantly.