SIF Trading Predictions
1 Day Prediction
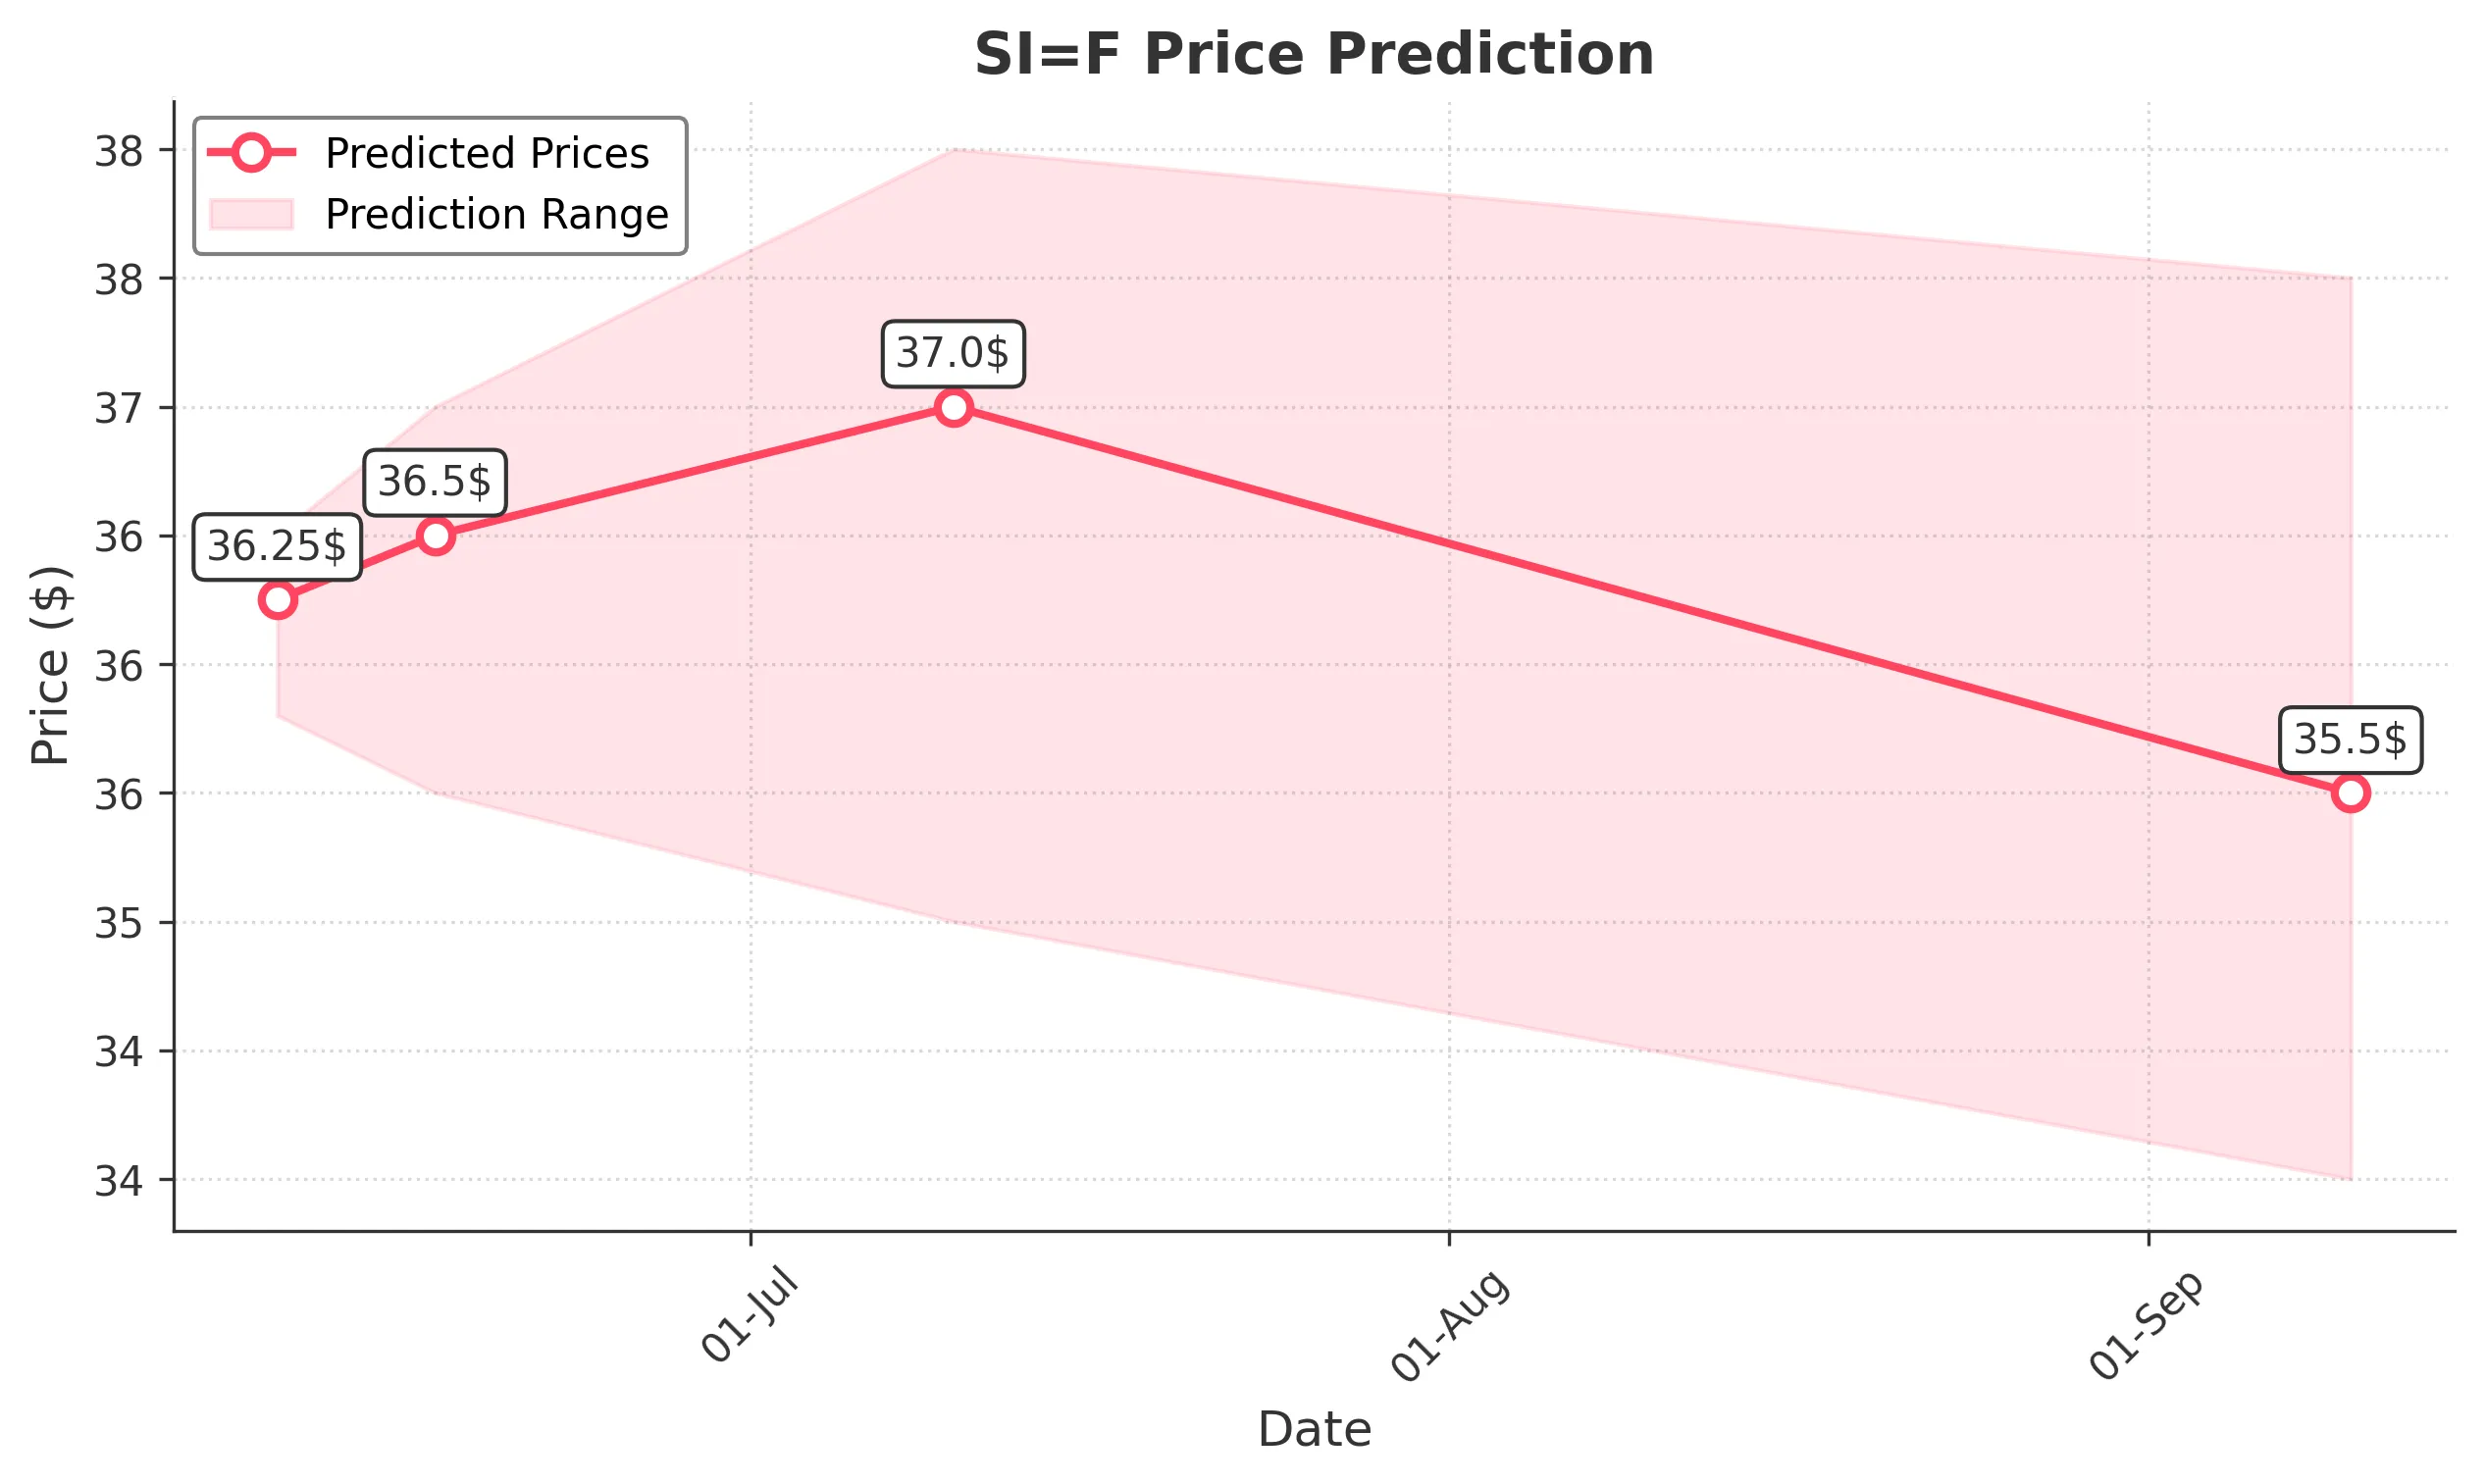
Target: June 10, 2025$36.25
$36.1
$36.5
$35.8
Description
The stock shows bullish momentum with a recent close above the 20-day moving average. RSI indicates overbought conditions, suggesting a potential pullback. However, MACD remains positive, supporting upward movement.
Analysis
The stock has been in a bullish trend, recently breaking resistance levels. The 20-day moving average supports upward momentum, while RSI indicates overbought conditions. Volume has been stable, but spikes could indicate volatility.
Confidence Level
Potential Risks
Potential profit-taking could lead to a slight decline. Market sentiment may shift due to external news.
1 Week Prediction
Target: June 17, 2025$36.5
$36.25
$37
$35.5
Description
The stock is expected to maintain its bullish trend, supported by strong momentum indicators. However, the RSI suggests a potential pullback, which could create buying opportunities at lower levels.
Analysis
The stock has shown consistent upward movement, with key support at $35.500. The MACD remains bullish, but the RSI indicates overbought conditions. Volume patterns suggest healthy trading activity, but caution is advised.
Confidence Level
Potential Risks
Market volatility and external economic factors could impact the stock's performance. Watch for any significant news that may affect sentiment.
1 Month Prediction
Target: July 10, 2025$37
$36.5
$38
$35
Description
The stock is likely to continue its upward trajectory, with strong support from technical indicators. However, the potential for a market correction exists, which could lead to temporary declines.
Analysis
The stock has been in a strong bullish phase, with significant resistance at $38.00. The MACD and moving averages support continued growth, but the RSI indicates potential overbought conditions. Volume trends are stable, but external factors could introduce risk.
Confidence Level
Potential Risks
Economic indicators and market sentiment could shift, leading to increased volatility. Watch for any bearish signals in the coming weeks.
3 Months Prediction
Target: September 10, 2025$35.5
$36
$37.5
$34
Description
Expect a potential pullback as the stock may face resistance at higher levels. The market could experience corrections, leading to lower prices in the medium term.
Analysis
The stock has shown strong performance but may face headwinds in the coming months. Key support levels are at $34.00, while resistance is at $37.50. The overall trend remains bullish, but caution is warranted due to potential market corrections.
Confidence Level
Potential Risks
Unforeseen macroeconomic events or shifts in market sentiment could significantly impact the stock's performance. Watch for bearish patterns.