SIF Trading Predictions
1 Day Prediction
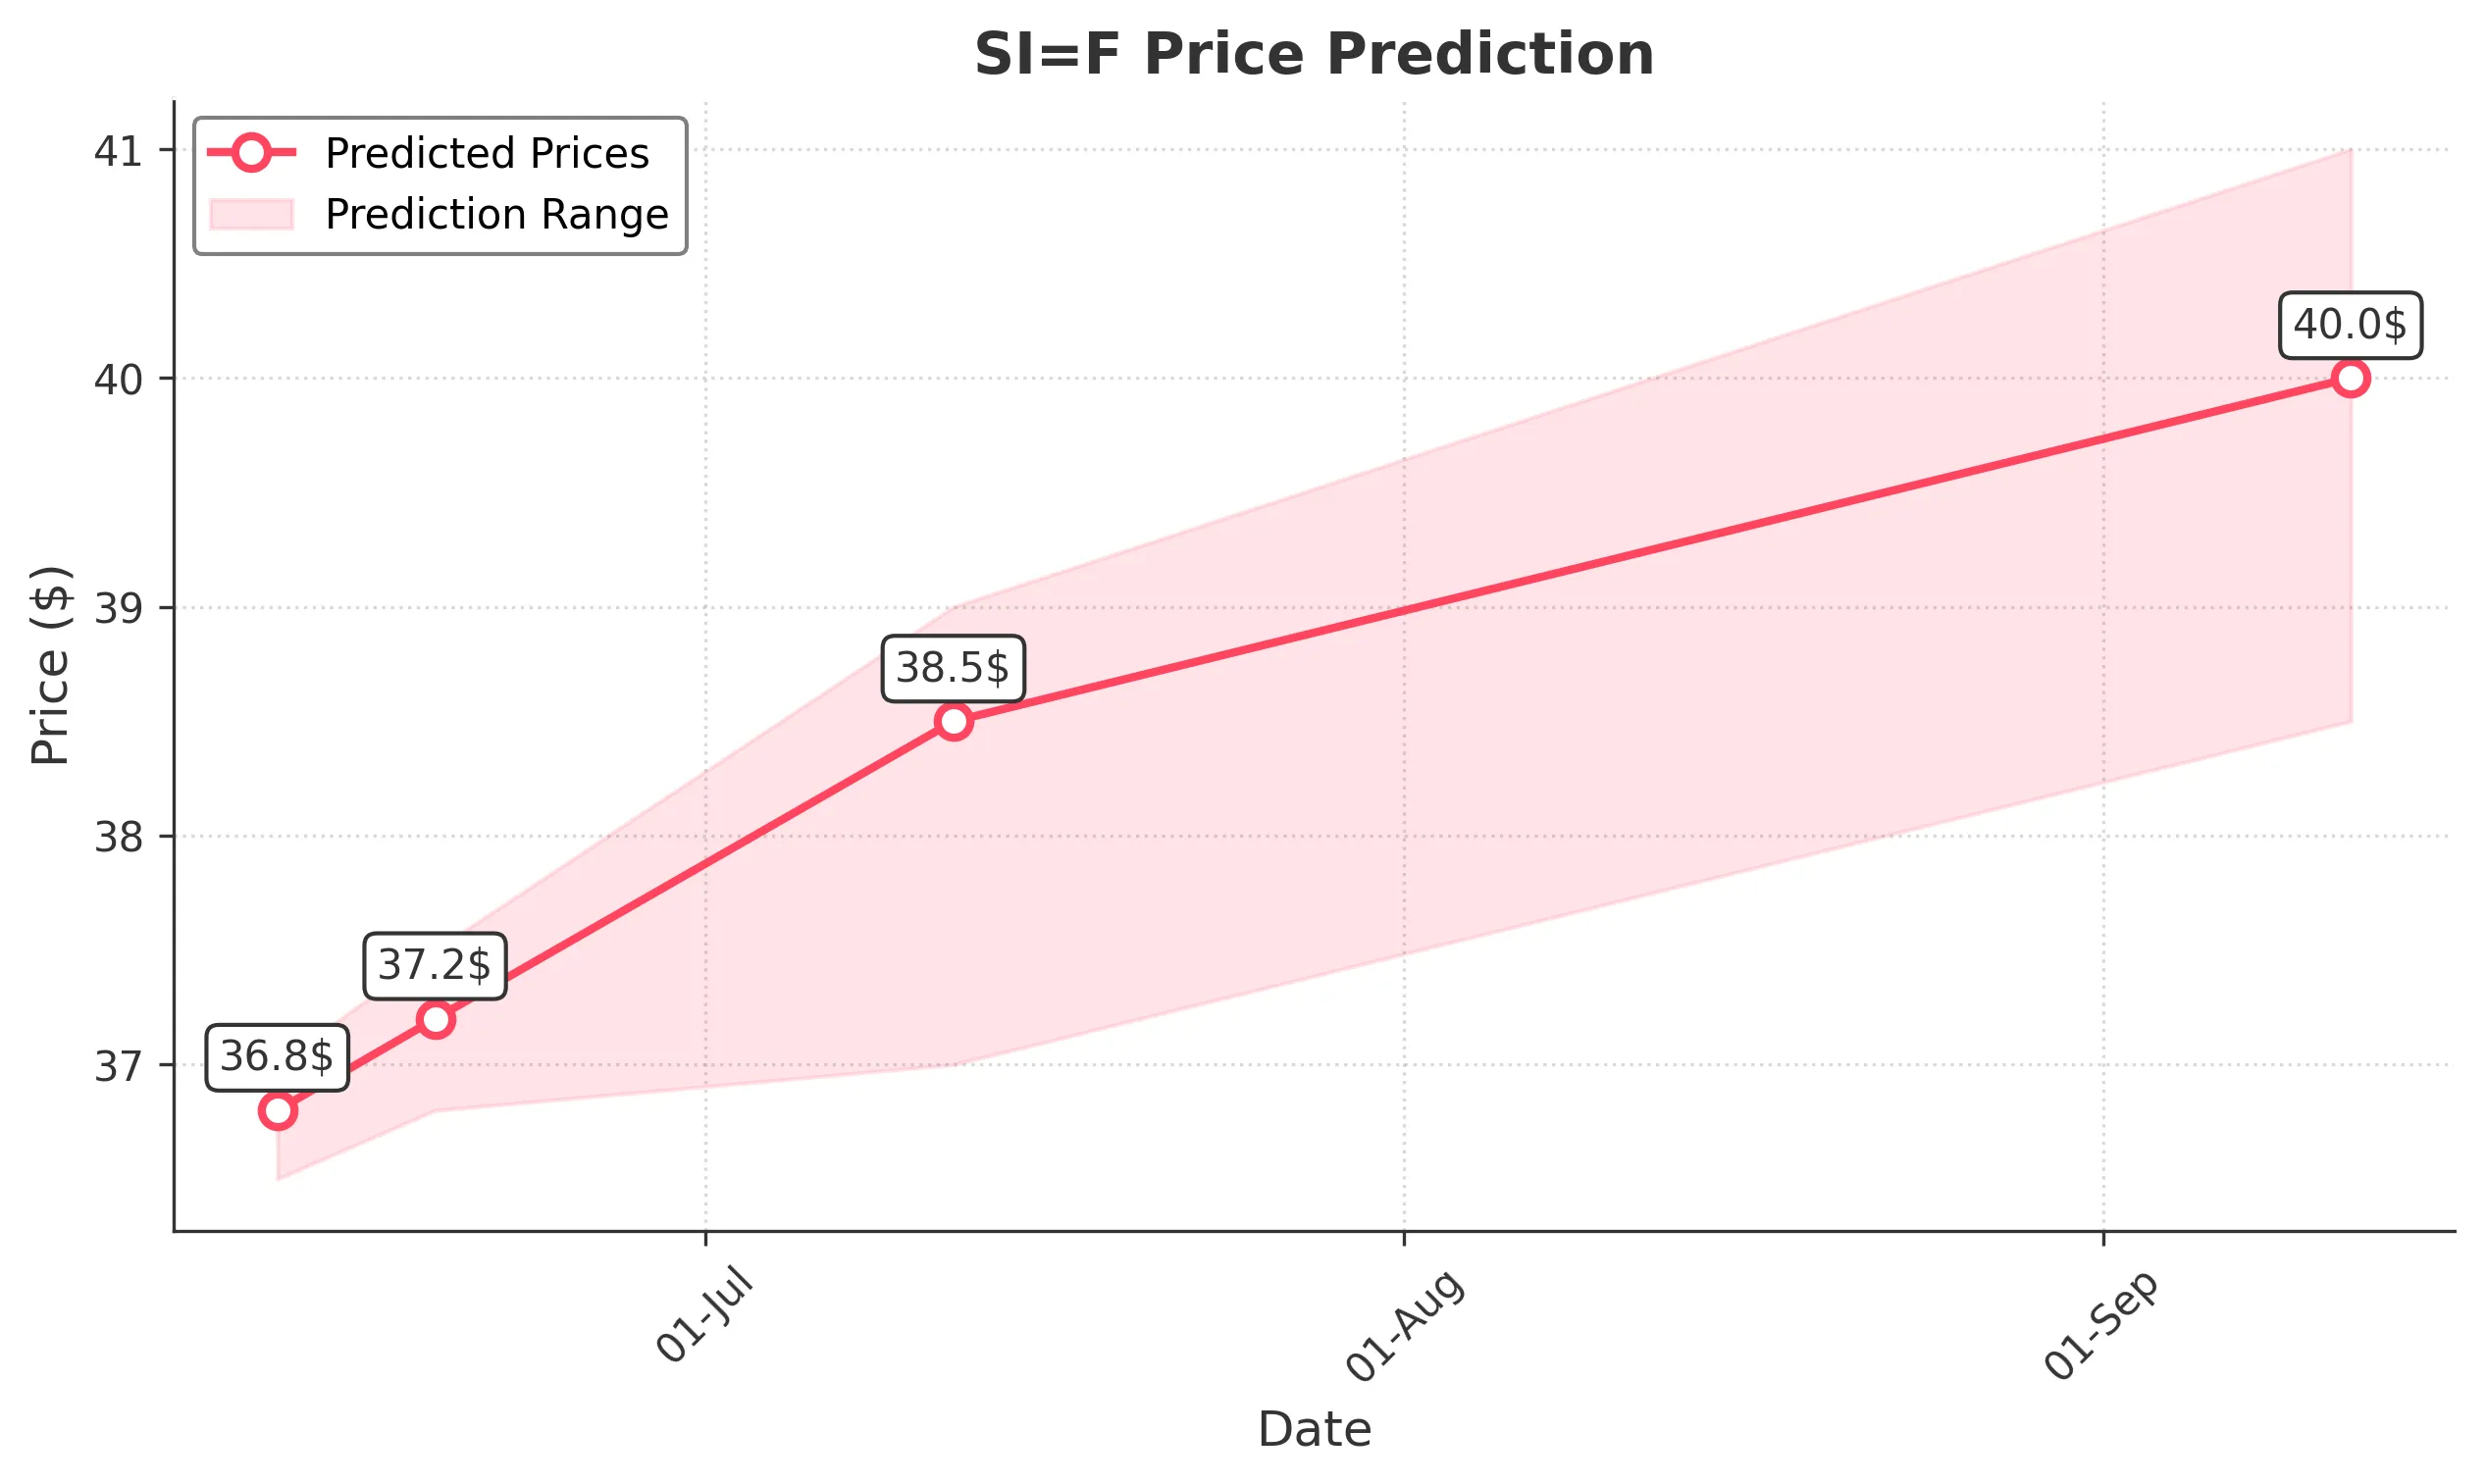
Target: June 12, 2025$36.8
$36.7
$37
$36.5
Description
The stock shows bullish momentum with a recent upward trend. The RSI is approaching overbought levels, indicating potential for a pullback. However, strong buying pressure is evident, suggesting a close around 36.800.
Analysis
The stock has been in a bullish trend, recently breaking resistance levels. The MACD shows positive momentum, while the ATR indicates increasing volatility. Volume has been stable, with some spikes indicating strong interest.
Confidence Level
Potential Risks
Potential for a pullback due to overbought RSI conditions and market volatility.
1 Week Prediction
Target: June 19, 2025$37.2
$36.9
$37.5
$36.8
Description
The stock is expected to continue its upward trajectory, supported by bullish candlestick patterns and a strong MACD. However, the RSI indicates potential overbought conditions, which could lead to short-term corrections.
Analysis
The stock has shown consistent upward movement, with key support at 36.500. The recent bullish engulfing pattern suggests further gains, but caution is warranted as the RSI nears overbought territory.
Confidence Level
Potential Risks
Market sentiment could shift due to external factors, impacting the bullish trend.
1 Month Prediction
Target: July 12, 2025$38.5
$37.8
$39
$37
Description
The stock is likely to reach new highs as bullish sentiment persists. Fibonacci retracement levels indicate strong support at 36.500, while the MACD remains positive. Watch for potential resistance at 39.000.
Analysis
The stock has been on a bullish run, with significant support at 36.500. The MACD and moving averages confirm the upward trend, while volume patterns suggest sustained interest. However, external economic factors could impact performance.
Confidence Level
Potential Risks
Economic indicators or earnings reports could introduce volatility.
3 Months Prediction
Target: September 12, 2025$40
$39
$41
$38.5
Description
Long-term bullish outlook as the stock breaks through key resistance levels. The overall market sentiment is positive, but watch for potential corrections as the RSI approaches overbought levels.
Analysis
The stock has shown strong performance over the past months, with key resistance at 39.000. The MACD indicates continued bullish momentum, but the potential for market corrections exists, especially if economic conditions change.
Confidence Level
Potential Risks
Market corrections and economic shifts could impact the bullish trend.