SIF Trading Predictions
1 Day Prediction
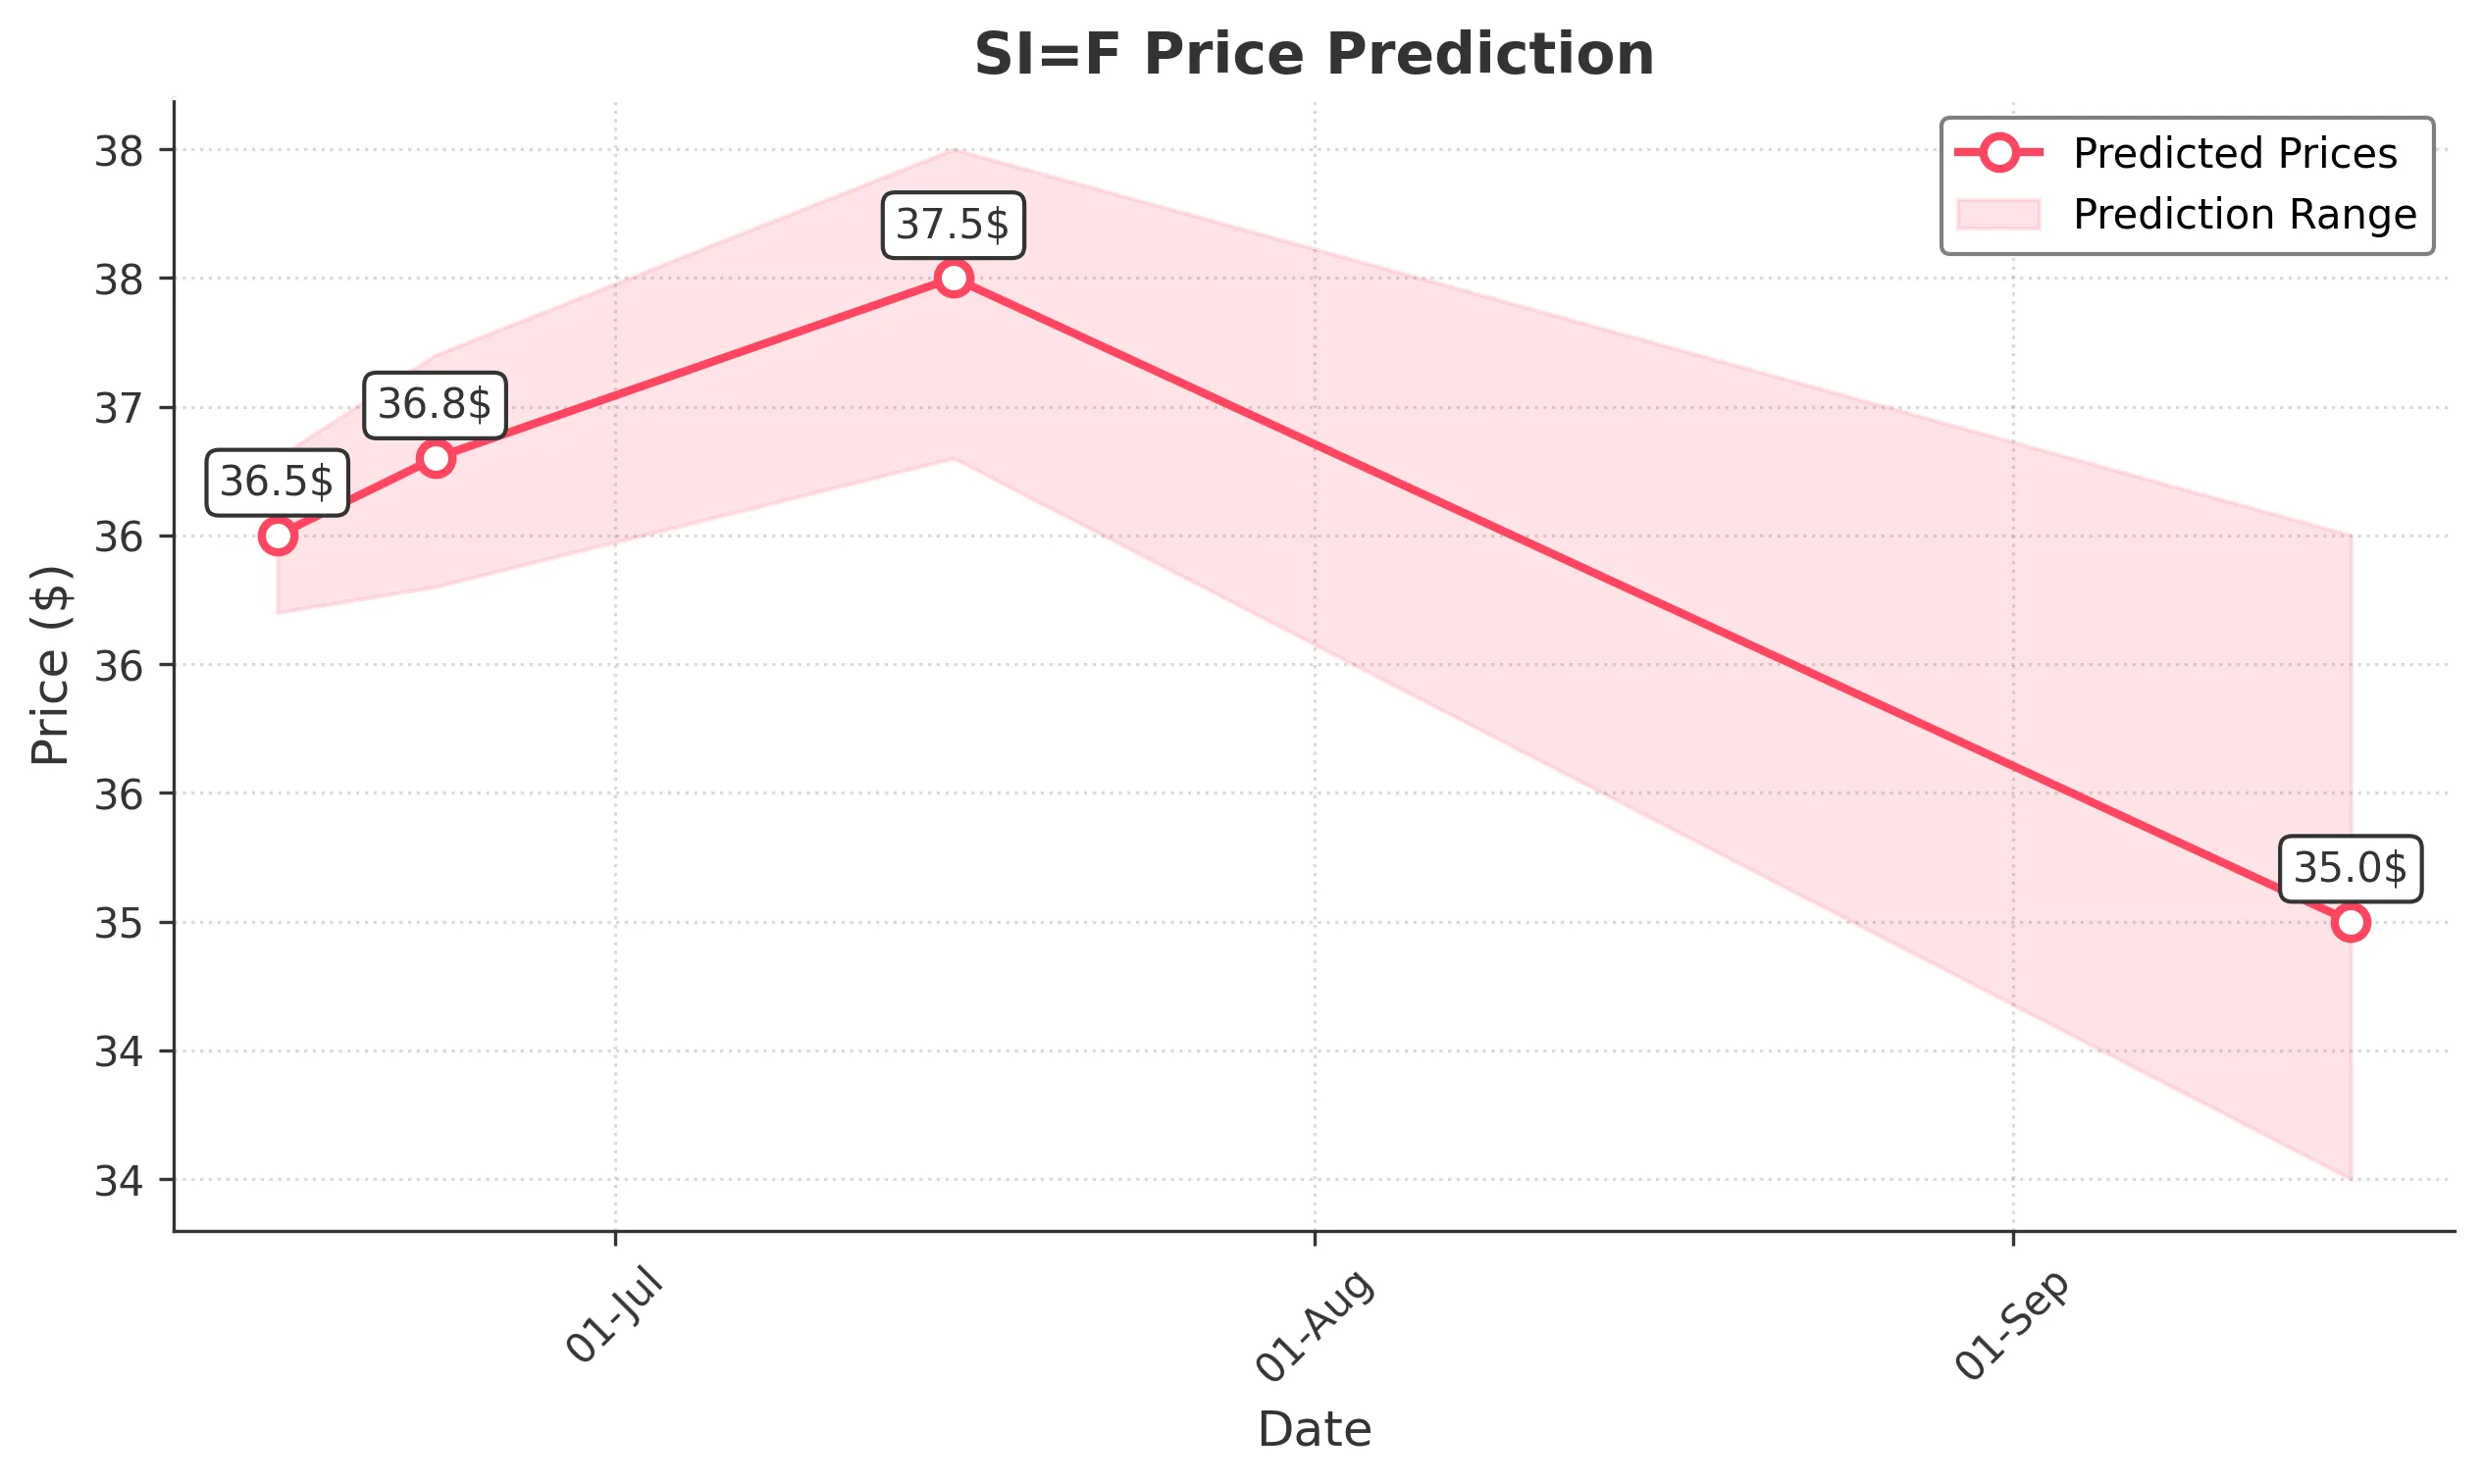
Target: June 16, 2025$36.5
$36.45
$36.8
$36.2
Description
The stock shows bullish momentum with a recent upward trend. The RSI is approaching overbought levels, indicating potential for a pullback. However, strong buying volume suggests continued upward pressure.
Analysis
Over the past 3 months, SI=F has shown a bullish trend, with significant support at 34.00 and resistance around 36.80. The MACD indicates upward momentum, while the ATR suggests moderate volatility. Recent volume spikes indicate strong interest.
Confidence Level
Potential Risks
Potential for a short-term pullback due to overbought RSI conditions.
1 Week Prediction
Target: June 23, 2025$36.8
$36.5
$37.2
$36.3
Description
The stock is expected to continue its upward trajectory, supported by bullish candlestick patterns and strong volume. However, the RSI indicates potential overbought conditions, which could lead to volatility.
Analysis
The stock has maintained a bullish trend with key support at 34.00. The MACD is positive, and the Bollinger Bands suggest potential for price expansion. Volume patterns indicate strong buying interest, but caution is warranted due to overbought signals.
Confidence Level
Potential Risks
Market sentiment could shift due to macroeconomic news, impacting the stock's performance.
1 Month Prediction
Target: July 16, 2025$37.5
$36.9
$38
$36.8
Description
The stock is likely to reach new highs as bullish momentum persists. The Fibonacci retracement levels suggest a target around 37.50, but watch for potential resistance at 38.00.
Analysis
The stock has shown consistent upward movement, with significant resistance at 38.00. The RSI is nearing overbought territory, and the MACD remains bullish. Volume trends indicate strong investor interest, but caution is advised as the market may react to external news.
Confidence Level
Potential Risks
External market factors and earnings reports could introduce volatility.
3 Months Prediction
Target: September 16, 2025$35
$36
$36.5
$34
Description
A potential correction may occur as the stock approaches resistance levels. The RSI indicates overbought conditions, and profit-taking could lead to a decline in price.
Analysis
The stock has experienced a bullish trend, but signs of exhaustion are emerging. Key support is at 34.00, while resistance is around 38.00. The MACD is showing signs of divergence, and volume patterns suggest potential profit-taking. External economic factors may also influence future performance.
Confidence Level
Potential Risks
Market volatility and economic conditions could significantly impact the stock's performance.