SIF Trading Predictions
1 Day Prediction
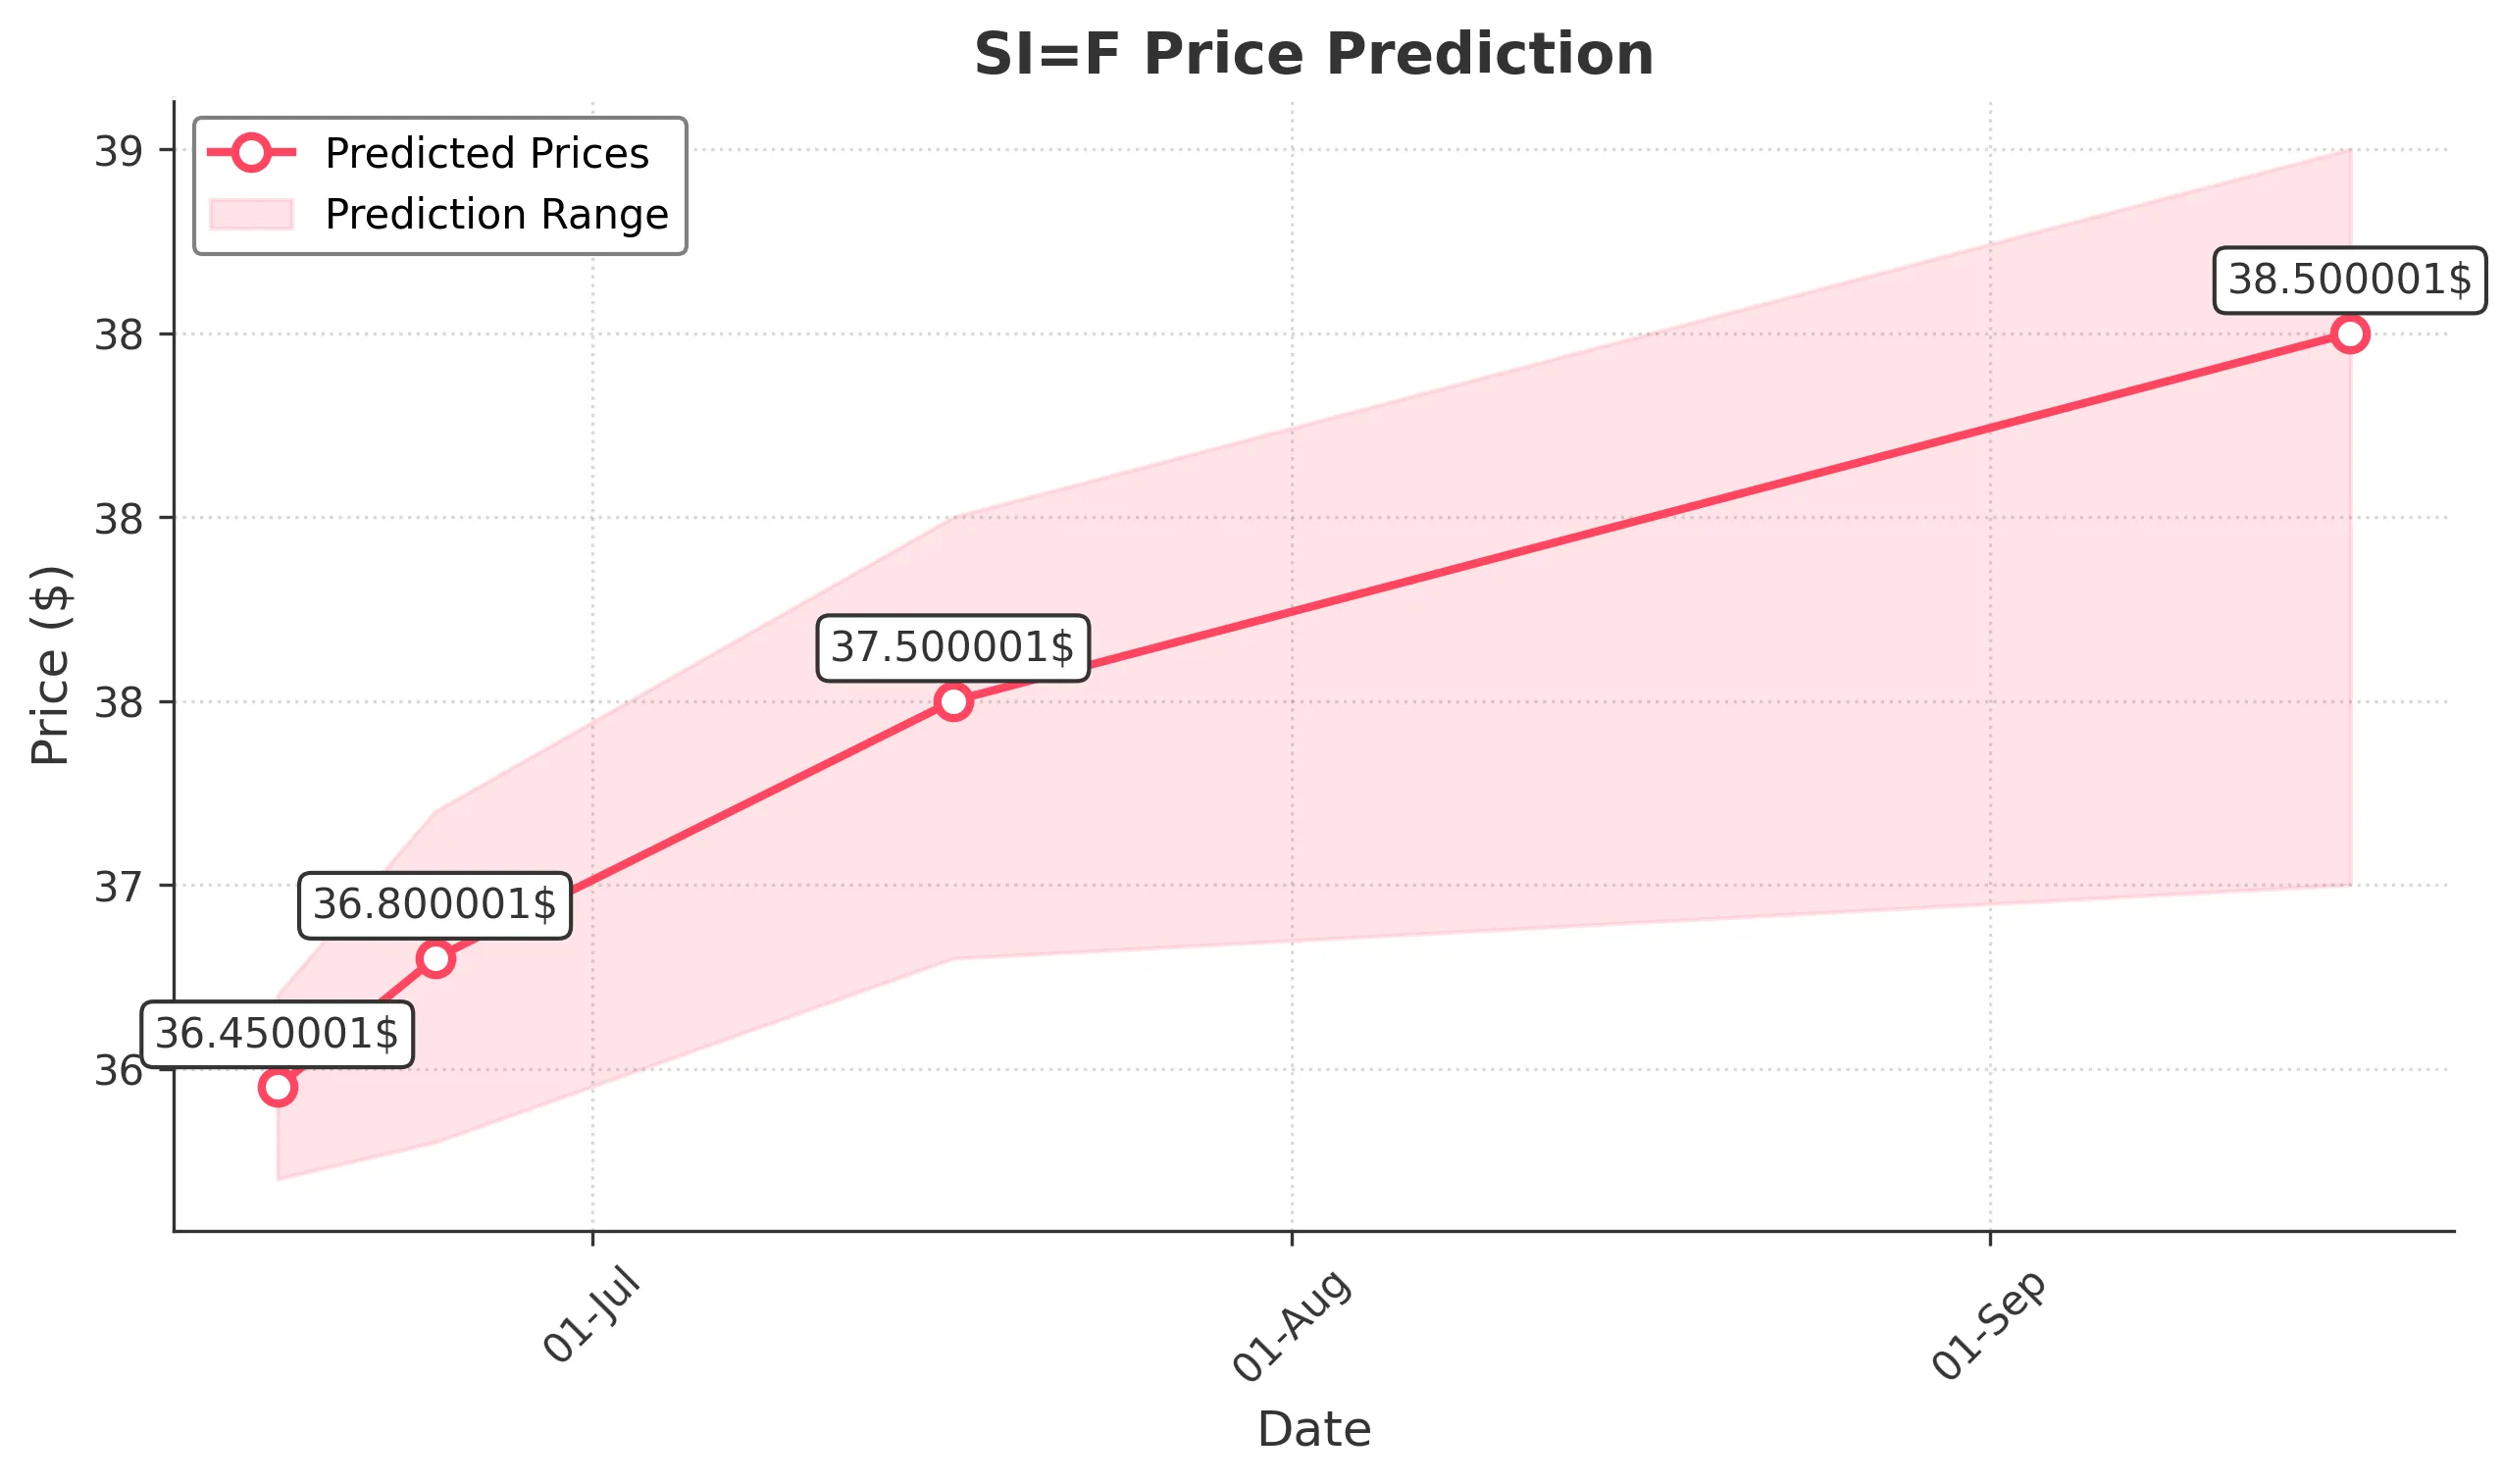
Target: June 17, 2025$36.450001
$36.290001
$36.700001
$36.200001
Description
The stock shows bullish momentum with a recent upward trend. The RSI is approaching overbought levels, indicating potential for a pullback. However, MACD remains positive, suggesting continued upward movement. Volume is expected to increase as traders react to recent highs.
Analysis
Over the past 3 months, SI=F has shown a bullish trend, recovering from lows around 29.11 to recent highs near 36.69. Key resistance is at 36.70, while support is around 34.50. Volume has been increasing, indicating strong interest. Technical indicators like MACD and moving averages support further gains, but caution is warranted due to potential overbought conditions.
Confidence Level
Potential Risks
Potential for a pullback due to overbought RSI conditions. Market sentiment may shift quickly.
1 Week Prediction
Target: June 24, 2025$36.800001
$36.450001
$37.200001
$36.300001
Description
The stock is expected to continue its upward trajectory, supported by strong bullish momentum. The MACD remains positive, and the price is above the 50-day moving average. However, the RSI indicates overbought conditions, which could lead to volatility.
Analysis
The stock has been on a bullish run, with significant support at 34.50 and resistance at 36.70. The recent price action shows a strong upward trend, but the RSI suggests caution as it approaches overbought territory. Volume patterns indicate increased interest, but any negative news could trigger a pullback.
Confidence Level
Potential Risks
Market volatility and potential profit-taking could lead to price corrections. Watch for external news that may impact sentiment.
1 Month Prediction
Target: July 17, 2025$37.500001
$36.800001
$38.000001
$36.800001
Description
The stock is likely to reach new highs as bullish sentiment persists. The MACD and moving averages support upward movement, but the RSI indicates potential overbought conditions. A correction may occur if profit-taking happens.
Analysis
SI=F has shown a strong recovery, with key support at 34.50 and resistance at 36.70. The stock's upward trend is supported by positive technical indicators, but the RSI suggests caution. Volume has been increasing, indicating strong interest, but potential market corrections could pose risks.
Confidence Level
Potential Risks
Market corrections and external economic factors could impact the stock's performance. Watch for changes in trading volume.
3 Months Prediction
Target: September 17, 2025$38.500001
$37.500001
$39.000001
$37.000001
Description
The stock is expected to continue its upward trend, driven by strong market sentiment and positive technical indicators. However, the RSI suggests potential overbought conditions, which could lead to volatility and corrections.
Analysis
Over the past three months, SI=F has shown a strong bullish trend, recovering from lows and approaching new highs. Key support is at 34.50, while resistance is at 36.70. The stock's performance is supported by positive technical indicators, but potential market corrections and external factors could pose risks.
Confidence Level
Potential Risks
Unforeseen macroeconomic events or shifts in market sentiment could impact the stock's trajectory. Watch for changes in trading volume and external news.