SIF Trading Predictions
1 Day Prediction
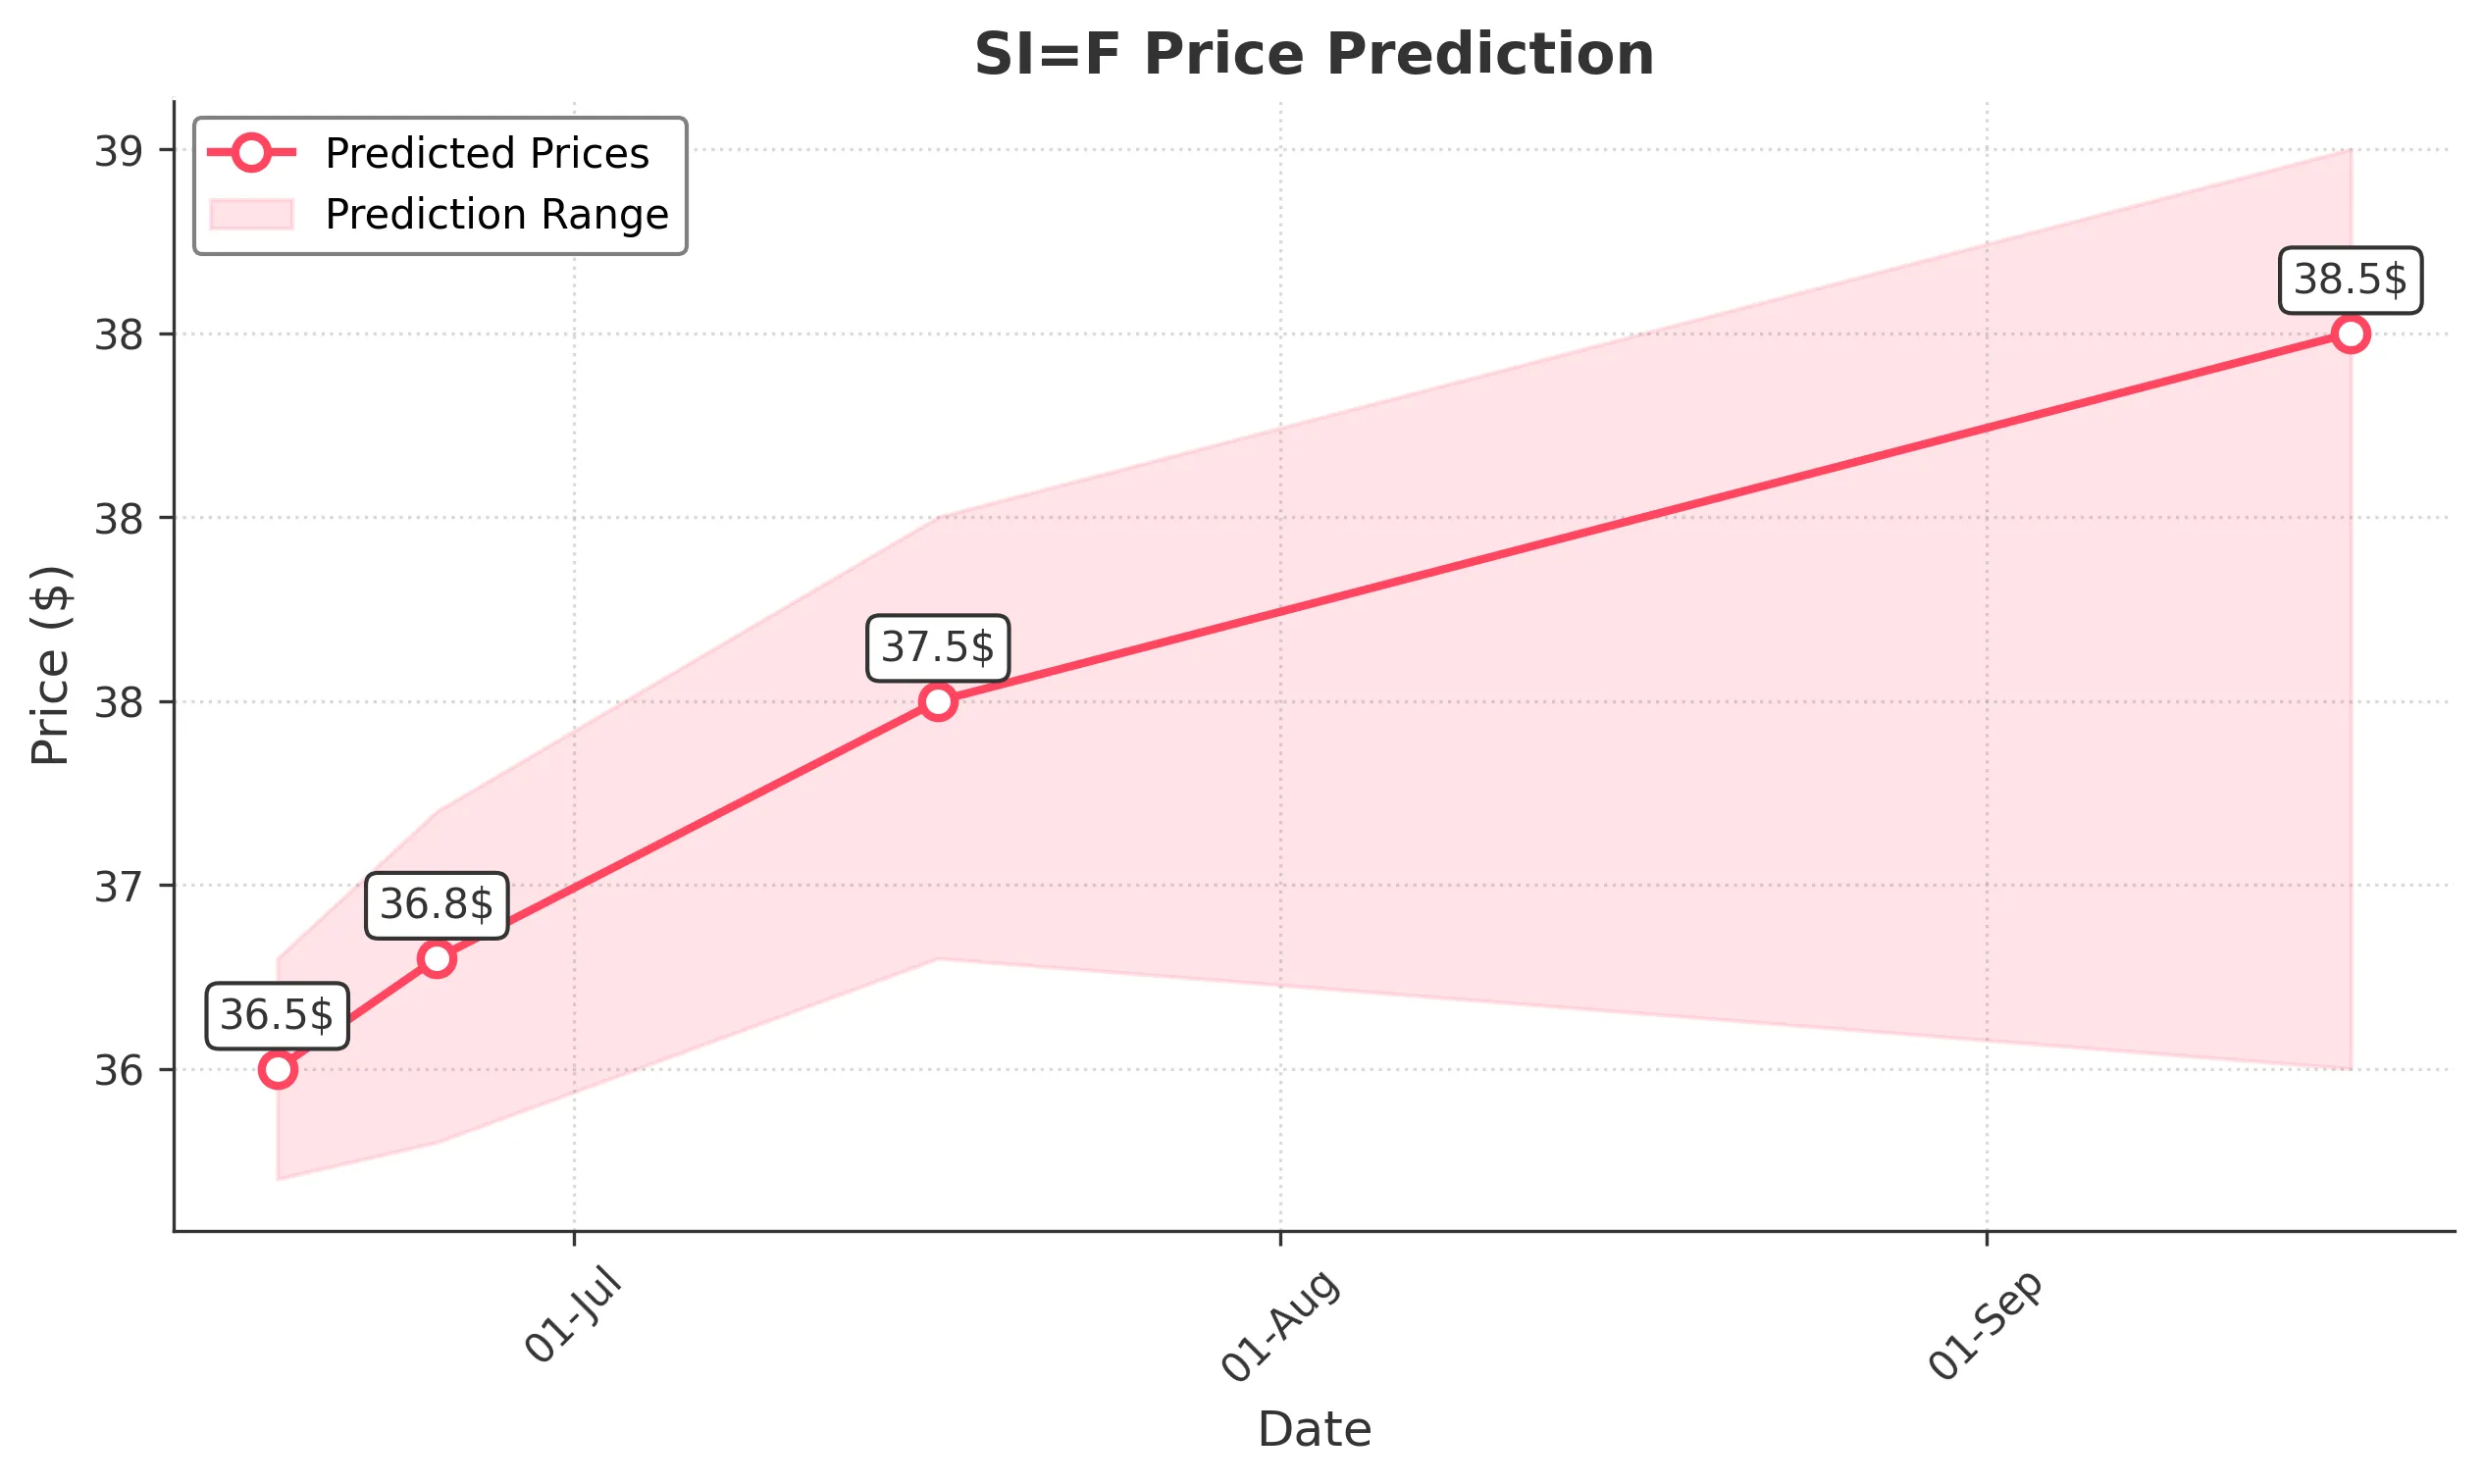
Target: June 18, 2025$36.5
$36.4
$36.8
$36.2
Description
The stock shows bullish momentum with a recent upward trend. The RSI is approaching overbought levels, indicating potential for a pullback. However, MACD remains positive, suggesting continued upward movement. Volume is expected to increase as traders react to recent highs.
Analysis
Over the past 3 months, SI=F has shown a bullish trend, with significant support at 34.00 and resistance around 36.80. The recent price action indicates strong buying interest, but the RSI nearing overbought levels suggests caution. Volume has been stable, with occasional spikes indicating increased interest.
Confidence Level
Potential Risks
Potential for a short-term pullback due to overbought RSI conditions.
1 Week Prediction
Target: June 25, 2025$36.8
$36.6
$37.2
$36.3
Description
The stock is expected to continue its upward trajectory, supported by strong bullish sentiment and positive MACD. However, the RSI indicates potential overbought conditions, which could lead to volatility. Watch for volume spikes as key resistance levels are approached.
Analysis
The stock has maintained a bullish trend with key support at 34.00 and resistance at 37.00. Technical indicators suggest continued upward momentum, but the RSI indicates caution. Volume patterns show increasing interest, but external market factors could introduce volatility.
Confidence Level
Potential Risks
Market volatility and potential profit-taking could impact price stability.
1 Month Prediction
Target: July 17, 2025$37.5
$36.9
$38
$36.8
Description
The stock is likely to reach new highs as bullish momentum persists. The MACD remains positive, and the price is above the 50-day moving average. However, the RSI indicates overbought conditions, suggesting a potential correction could occur.
Analysis
SI=F has shown a strong upward trend, with significant resistance at 38.00. The stock's performance has been buoyed by positive sentiment and strong volume. However, the overbought RSI suggests caution, as corrections may occur. Monitoring macroeconomic events will be crucial.
Confidence Level
Potential Risks
Possible market corrections and external economic factors could affect the prediction.
3 Months Prediction
Target: September 17, 2025$38.5
$37.8
$39
$36.5
Description
The stock is expected to continue its upward trend, driven by strong fundamentals and market sentiment. However, potential resistance at 39.00 may lead to volatility. The MACD remains bullish, but watch for RSI corrections.
Analysis
Over the past three months, SI=F has shown a bullish trend with key support at 36.00 and resistance at 39.00. The stock's performance has been strong, but the potential for market corrections exists. Technical indicators suggest continued upward momentum, but external factors could introduce volatility.
Confidence Level
Potential Risks
Long-term predictions are subject to market fluctuations and economic changes.