SIF Trading Predictions
1 Day Prediction
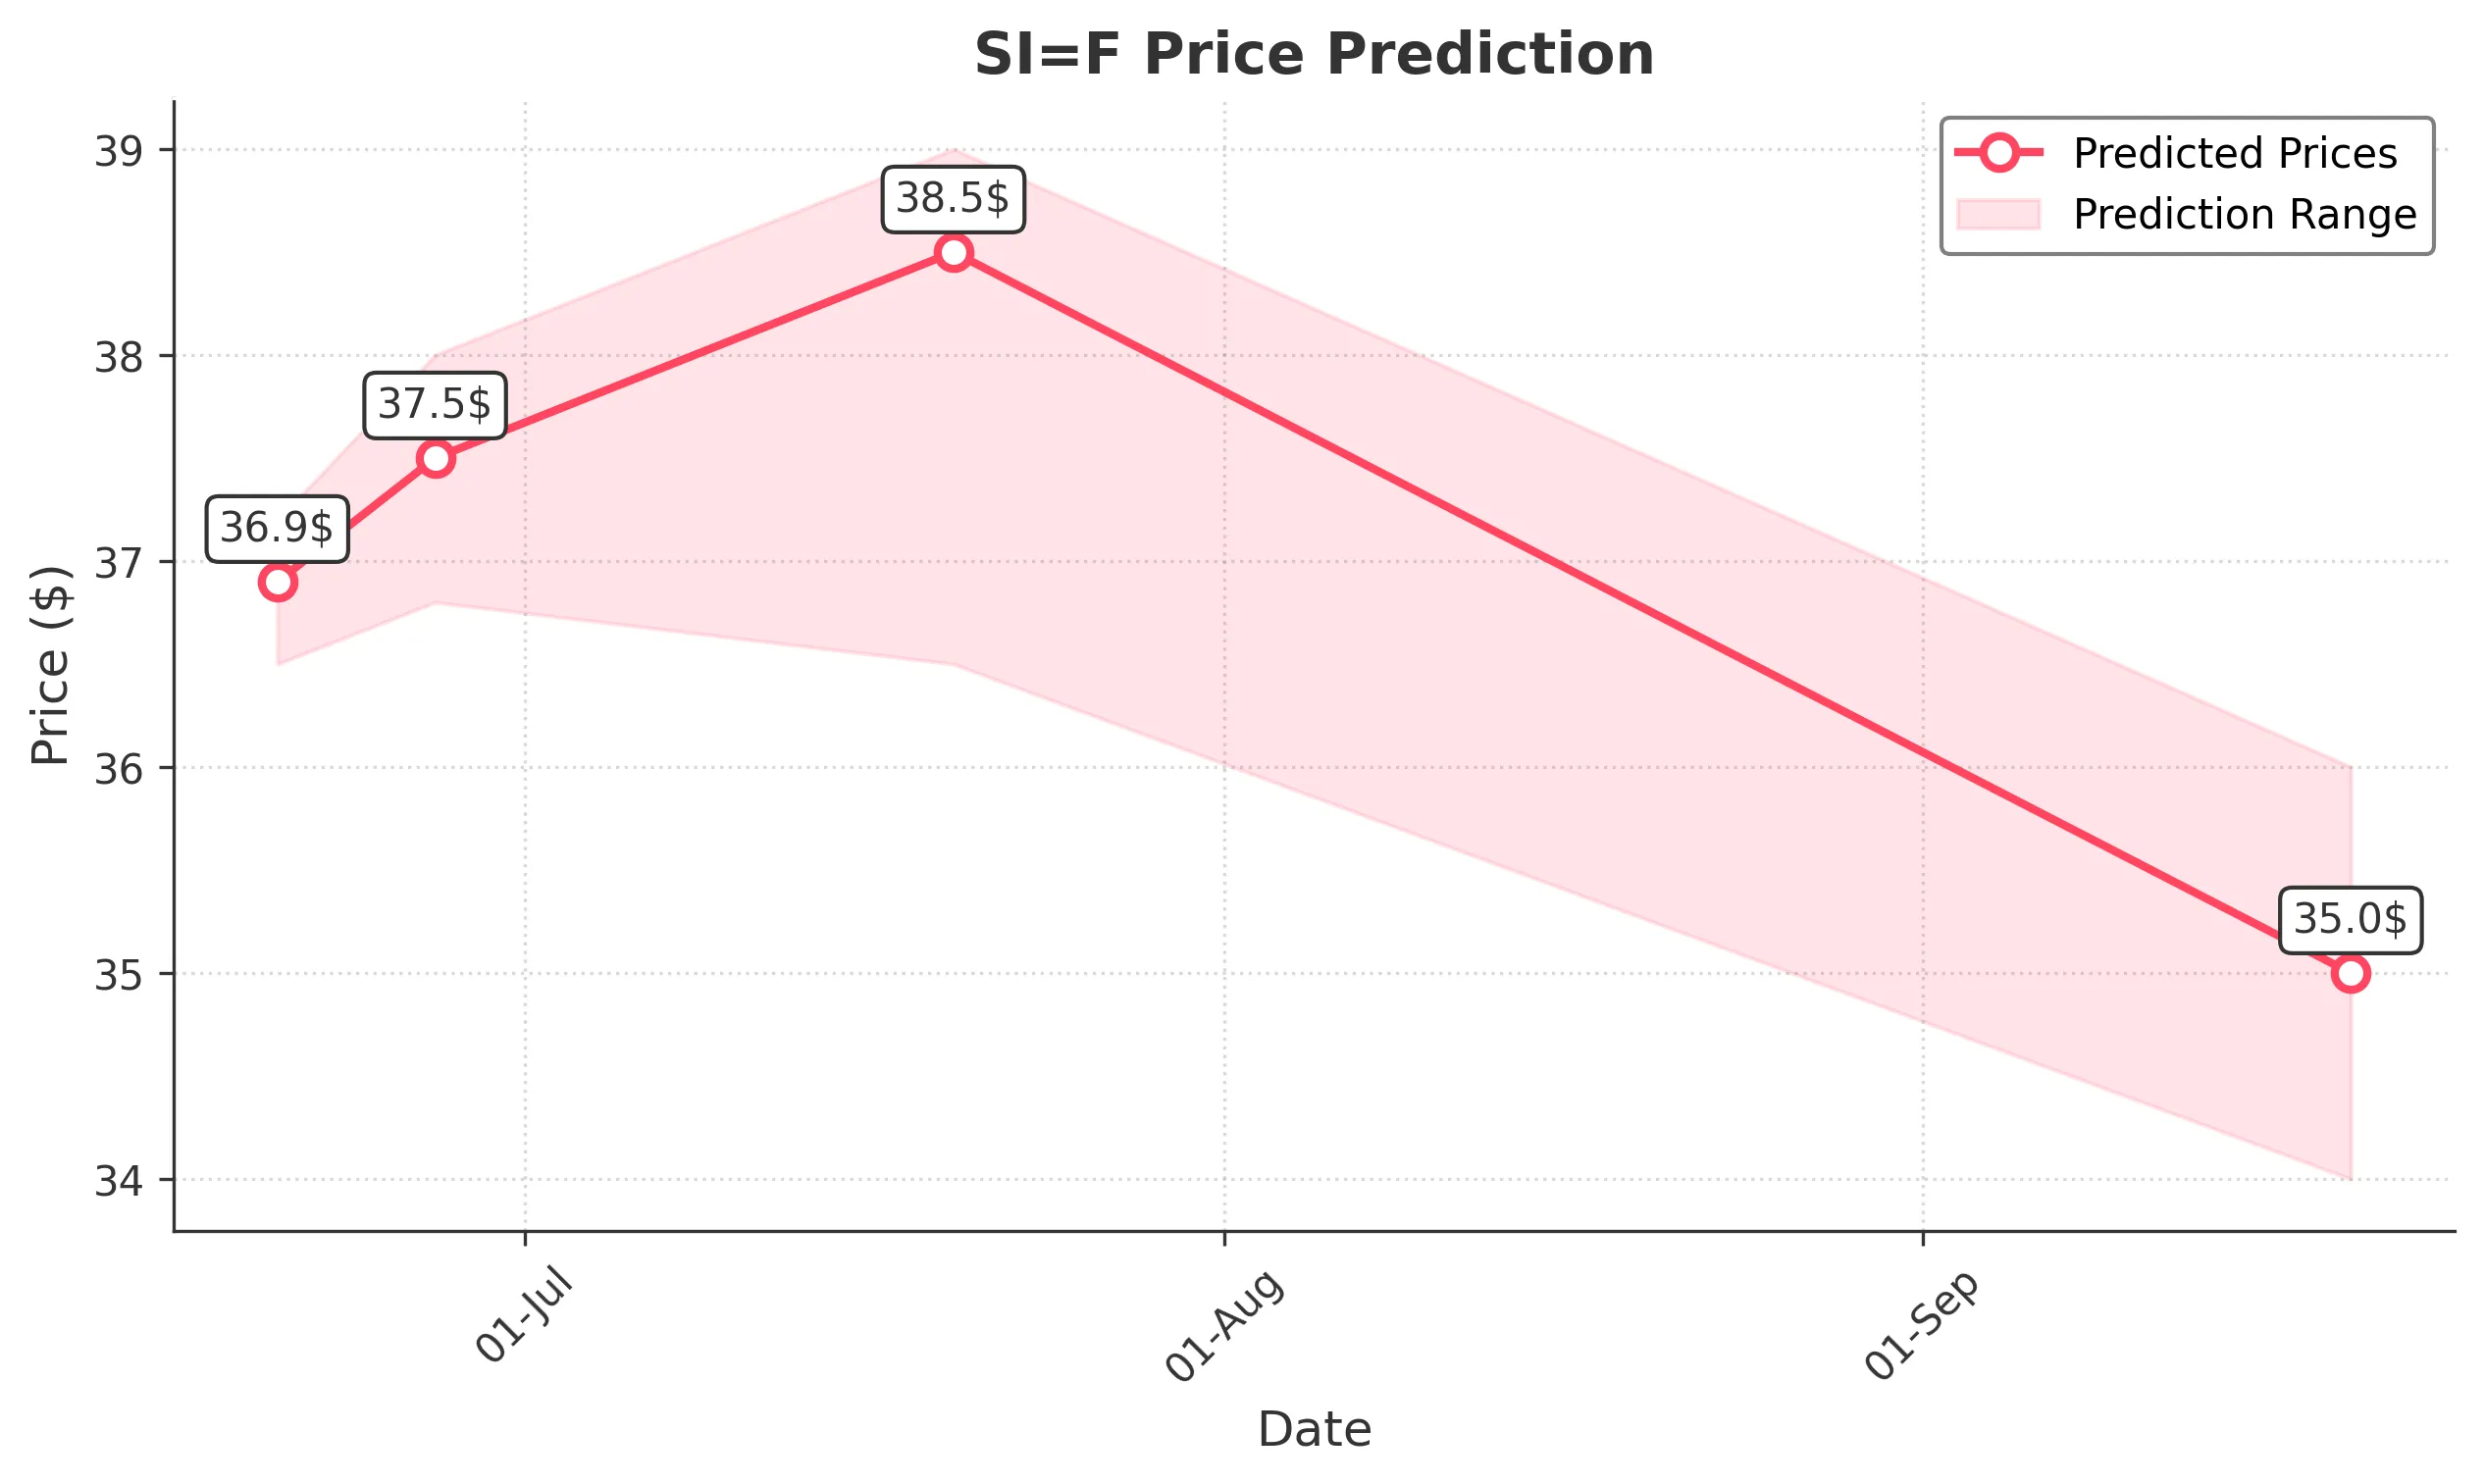
Target: June 20, 2025$36.9
$36.8
$37.2
$36.5
Description
The stock shows bullish momentum with a recent upward trend. The RSI is approaching overbought levels, indicating potential for a pullback. However, MACD remains positive, suggesting continued upward movement. Volume is expected to increase as traders react to recent highs.
Analysis
Over the past 3 months, SI=F has shown a bullish trend, with significant support at 36.00 and resistance around 37.00. The MACD is bullish, and the ATR indicates moderate volatility. Recent candlestick patterns suggest bullish sentiment, but caution is advised due to potential overextension.
Confidence Level
Potential Risks
Potential for a short-term pullback due to overbought RSI conditions.
1 Week Prediction
Target: June 27, 2025$37.5
$36.9
$38
$36.8
Description
The stock is expected to continue its upward trajectory, supported by strong buying interest. The MACD remains bullish, and the price is likely to test the resistance level at 38.00. However, watch for potential profit-taking as the RSI approaches overbought territory.
Analysis
The stock has been in a bullish phase, with key support at 36.00 and resistance at 38.00. The recent increase in volume indicates strong interest. However, the RSI nearing overbought levels suggests caution, as a pullback could occur if profit-taking ensues.
Confidence Level
Potential Risks
Market sentiment could shift quickly, leading to profit-taking or a reversal.
1 Month Prediction
Target: July 20, 2025$38.5
$37.8
$39
$36.5
Description
The stock is projected to reach new highs as bullish momentum persists. The MACD remains positive, and the price is likely to break through resistance at 38.00. However, the RSI indicates potential overbought conditions, which could lead to volatility.
Analysis
SI=F has shown a strong upward trend, with significant resistance at 38.00. The MACD supports continued bullish momentum, but the RSI suggests caution. Volume patterns indicate strong interest, but external factors could introduce volatility.
Confidence Level
Potential Risks
External market factors or economic news could impact the stock's performance.
3 Months Prediction
Target: September 20, 2025$35
$35.5
$36
$34
Description
A potential correction is anticipated as the stock may face resistance at higher levels. The RSI indicates overbought conditions, and profit-taking could lead to a decline. Watch for support around 34.00 as a critical level.
Analysis
The stock has experienced a bullish trend, but signs of exhaustion are emerging. Key support is at 34.00, while resistance is around 38.00. The MACD is showing signs of divergence, indicating potential weakness. External economic factors could also influence performance.
Confidence Level
Potential Risks
Market volatility and economic conditions could lead to unexpected price movements.