SIF Trading Predictions
1 Day Prediction
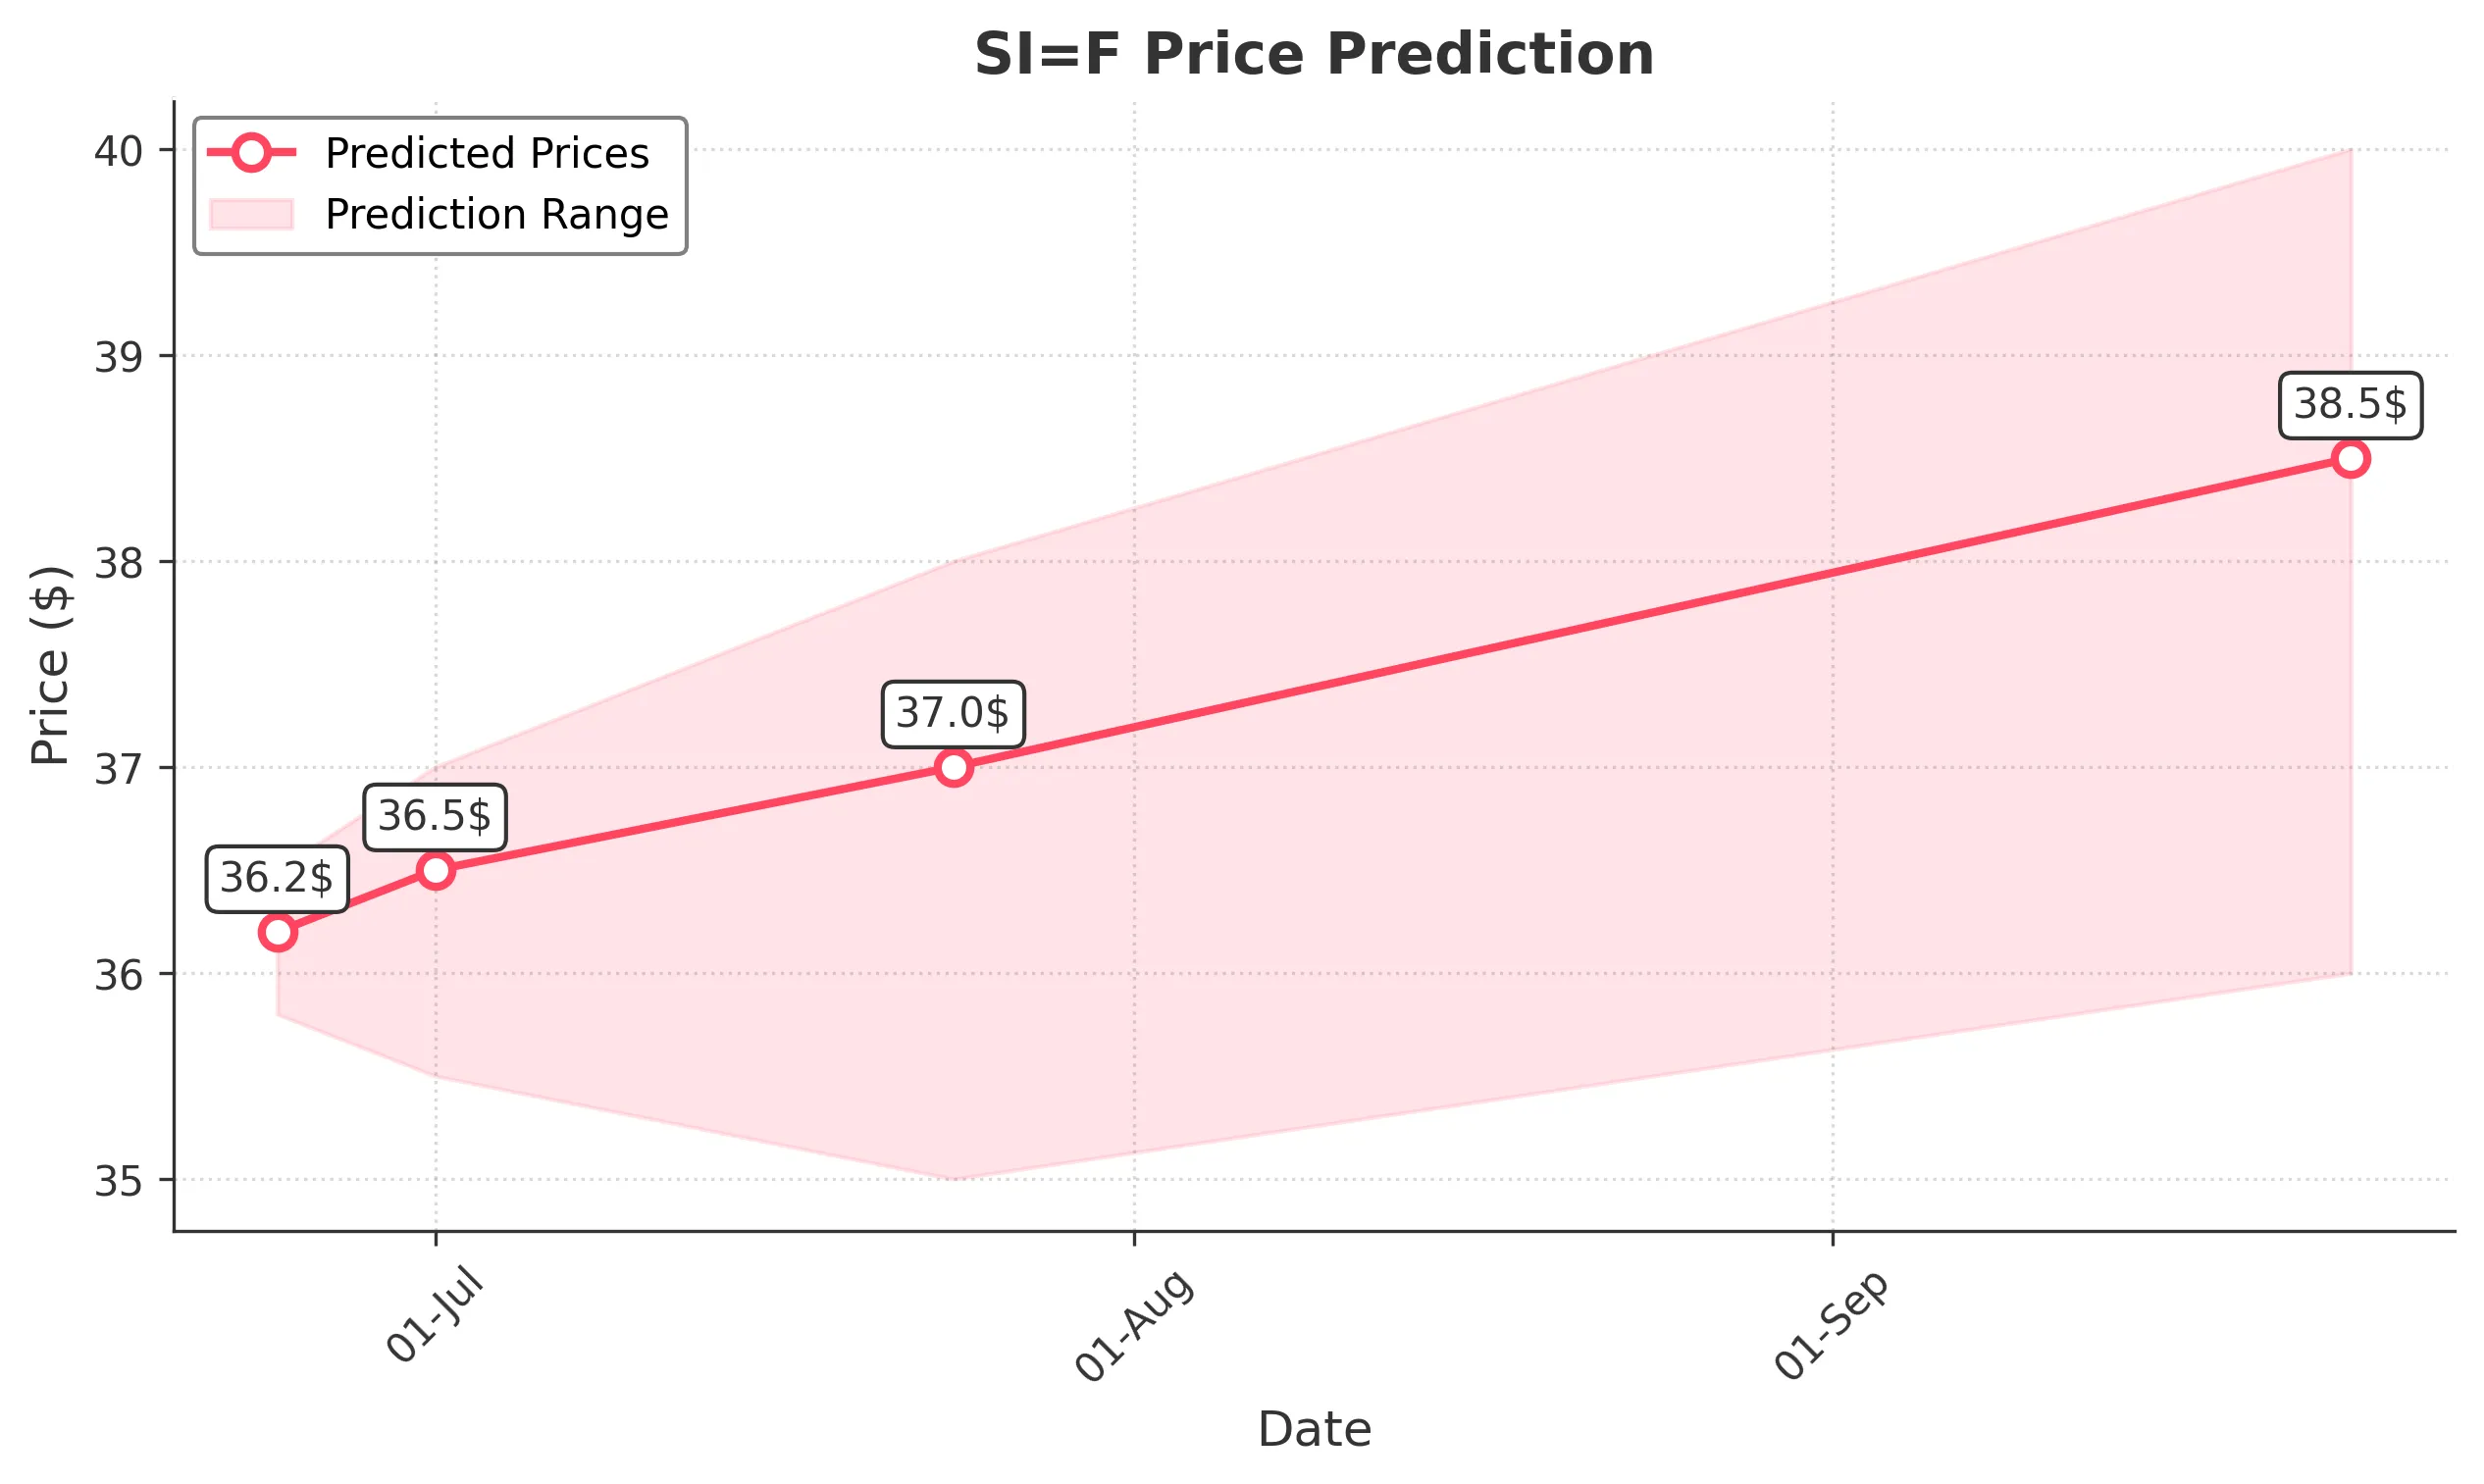
Target: June 24, 2025$36.2
$36.1
$36.5
$35.8
Description
The stock shows a bullish trend with a recent close above the 50-day moving average. RSI indicates overbought conditions, suggesting a potential pullback. However, MACD remains positive, supporting upward momentum.
Analysis
Over the past 3 months, SI=F has shown a bullish trend, with significant support at $35.50 and resistance around $37.00. The recent price action indicates strong buying interest, but RSI suggests caution due to overbought conditions.
Confidence Level
Potential Risks
Potential volatility due to market sentiment shifts or macroeconomic news could impact the prediction.
1 Week Prediction
Target: July 1, 2025$36.5
$36.3
$37
$35.5
Description
The stock is expected to maintain its upward trajectory, supported by bullish candlestick patterns. However, the RSI indicates potential overbought conditions, which may lead to a short-term pullback.
Analysis
The stock has been trending upward, with key support at $35.50 and resistance at $37.00. Volume has been increasing, indicating strong interest. However, the overbought RSI suggests caution for short-term traders.
Confidence Level
Potential Risks
Market volatility and external economic factors could lead to unexpected price movements.
1 Month Prediction
Target: July 24, 2025$37
$36.8
$38
$35
Description
The stock is likely to continue its bullish trend, with strong support at $35.50. The MACD indicates a bullish crossover, while the RSI may stabilize as the price consolidates.
Analysis
SI=F has shown a consistent upward trend, with significant support at $35.50 and resistance at $38.00. The MACD and moving averages support bullish momentum, but caution is warranted due to potential overbought conditions.
Confidence Level
Potential Risks
Economic data releases or geopolitical events could introduce volatility.
3 Months Prediction
Target: September 24, 2025$38.5
$37.5
$40
$36
Description
Long-term bullish sentiment is supported by strong fundamentals and technical indicators. However, potential market corrections could lead to volatility.
Analysis
The stock has been on a bullish trajectory, with key support at $36.00 and resistance at $40.00. The overall market sentiment is positive, but external factors could introduce risks. The stock's performance will depend on broader economic conditions.
Confidence Level
Potential Risks
Unforeseen macroeconomic events or shifts in market sentiment could impact the stock's performance.