SIF Trading Predictions
1 Day Prediction
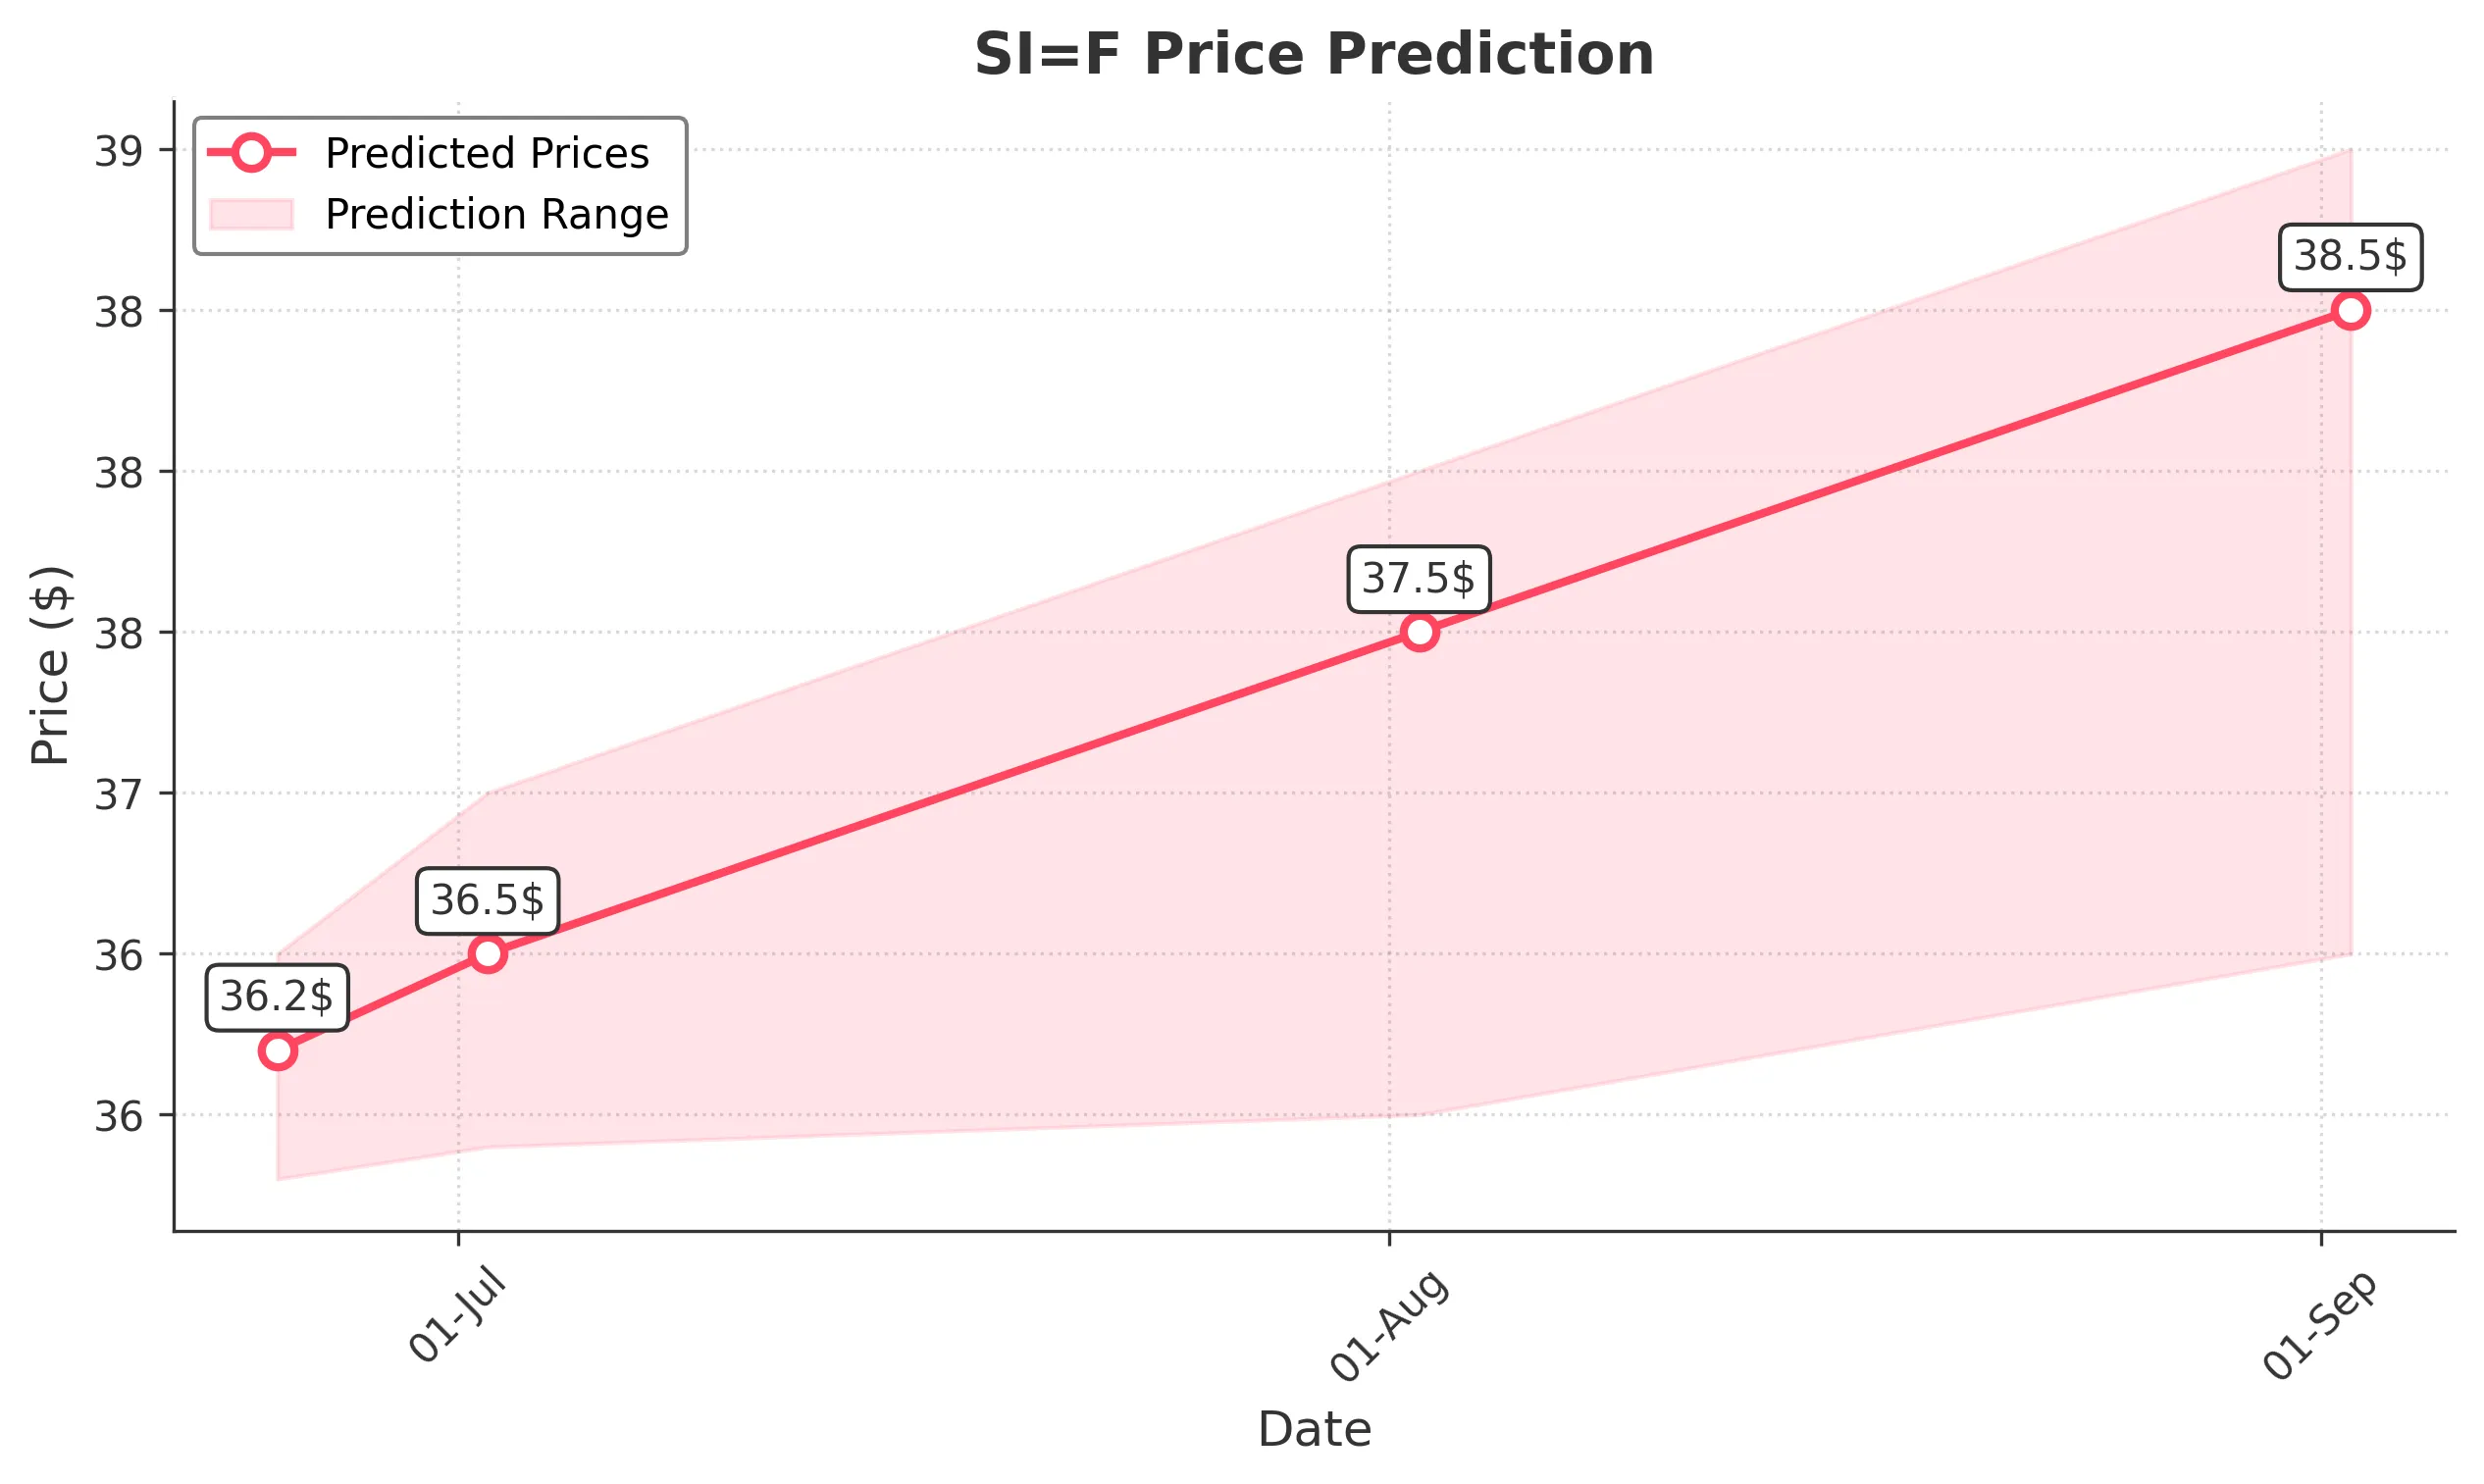
Target: June 25, 2025$36.2
$36.15
$36.5
$35.8
Description
The stock shows a bullish trend with a recent upward movement. The RSI is approaching overbought levels, indicating potential for a pullback. However, the MACD is positive, suggesting continued momentum. Volume has been stable, supporting the price action.
Analysis
Over the past 3 months, SI=F has shown a bullish trend, with significant support around 35.00 and resistance near 37.00. The MACD indicates upward momentum, while the RSI suggests caution as it nears overbought territory. Volume patterns have been consistent, with occasional spikes indicating strong interest.
Confidence Level
Potential Risks
Potential market volatility and profit-taking could lead to a price correction.
1 Week Prediction
Target: July 2, 2025$36.5
$36.3
$37
$35.9
Description
The stock is expected to maintain its upward trajectory, supported by bullish sentiment and positive technical indicators. The recent candlestick patterns suggest continuation, but the RSI indicates potential overbought conditions, which could lead to volatility.
Analysis
The stock has been in a bullish phase, with key support at 35.00 and resistance at 37.00. The MACD remains positive, and the Bollinger Bands indicate potential for price expansion. However, the RSI nearing overbought levels suggests caution for short-term traders.
Confidence Level
Potential Risks
Market sentiment can shift quickly, and external factors may impact performance.
1 Month Prediction
Target: August 2, 2025$37.5
$36.8
$38
$36
Description
The stock is likely to continue its upward trend, driven by strong market sentiment and positive technical indicators. However, the RSI indicates potential overbought conditions, which may lead to corrections. Watch for volume spikes as a sign of strength.
Analysis
SI=F has shown a strong bullish trend, with significant support at 35.00 and resistance at 38.00. The MACD is bullish, and the RSI is approaching overbought levels. Volume has been increasing, indicating strong interest, but caution is warranted due to potential pullbacks.
Confidence Level
Potential Risks
Economic data releases and geopolitical events could introduce volatility.
3 Months Prediction
Target: September 2, 2025$38.5
$37
$39
$36.5
Description
The stock is expected to maintain a bullish trend, supported by strong fundamentals and positive market sentiment. However, the RSI suggests potential overbought conditions, which could lead to corrections. Monitor for any changes in macroeconomic conditions.
Analysis
Over the past three months, SI=F has demonstrated a strong upward trend, with key support at 36.00 and resistance at 39.00. The MACD remains bullish, but the RSI indicates overbought conditions. Volume patterns suggest strong interest, but external factors could impact future performance.
Confidence Level
Potential Risks
Long-term predictions are subject to market volatility and economic changes.