SIF Trading Predictions
1 Day Prediction
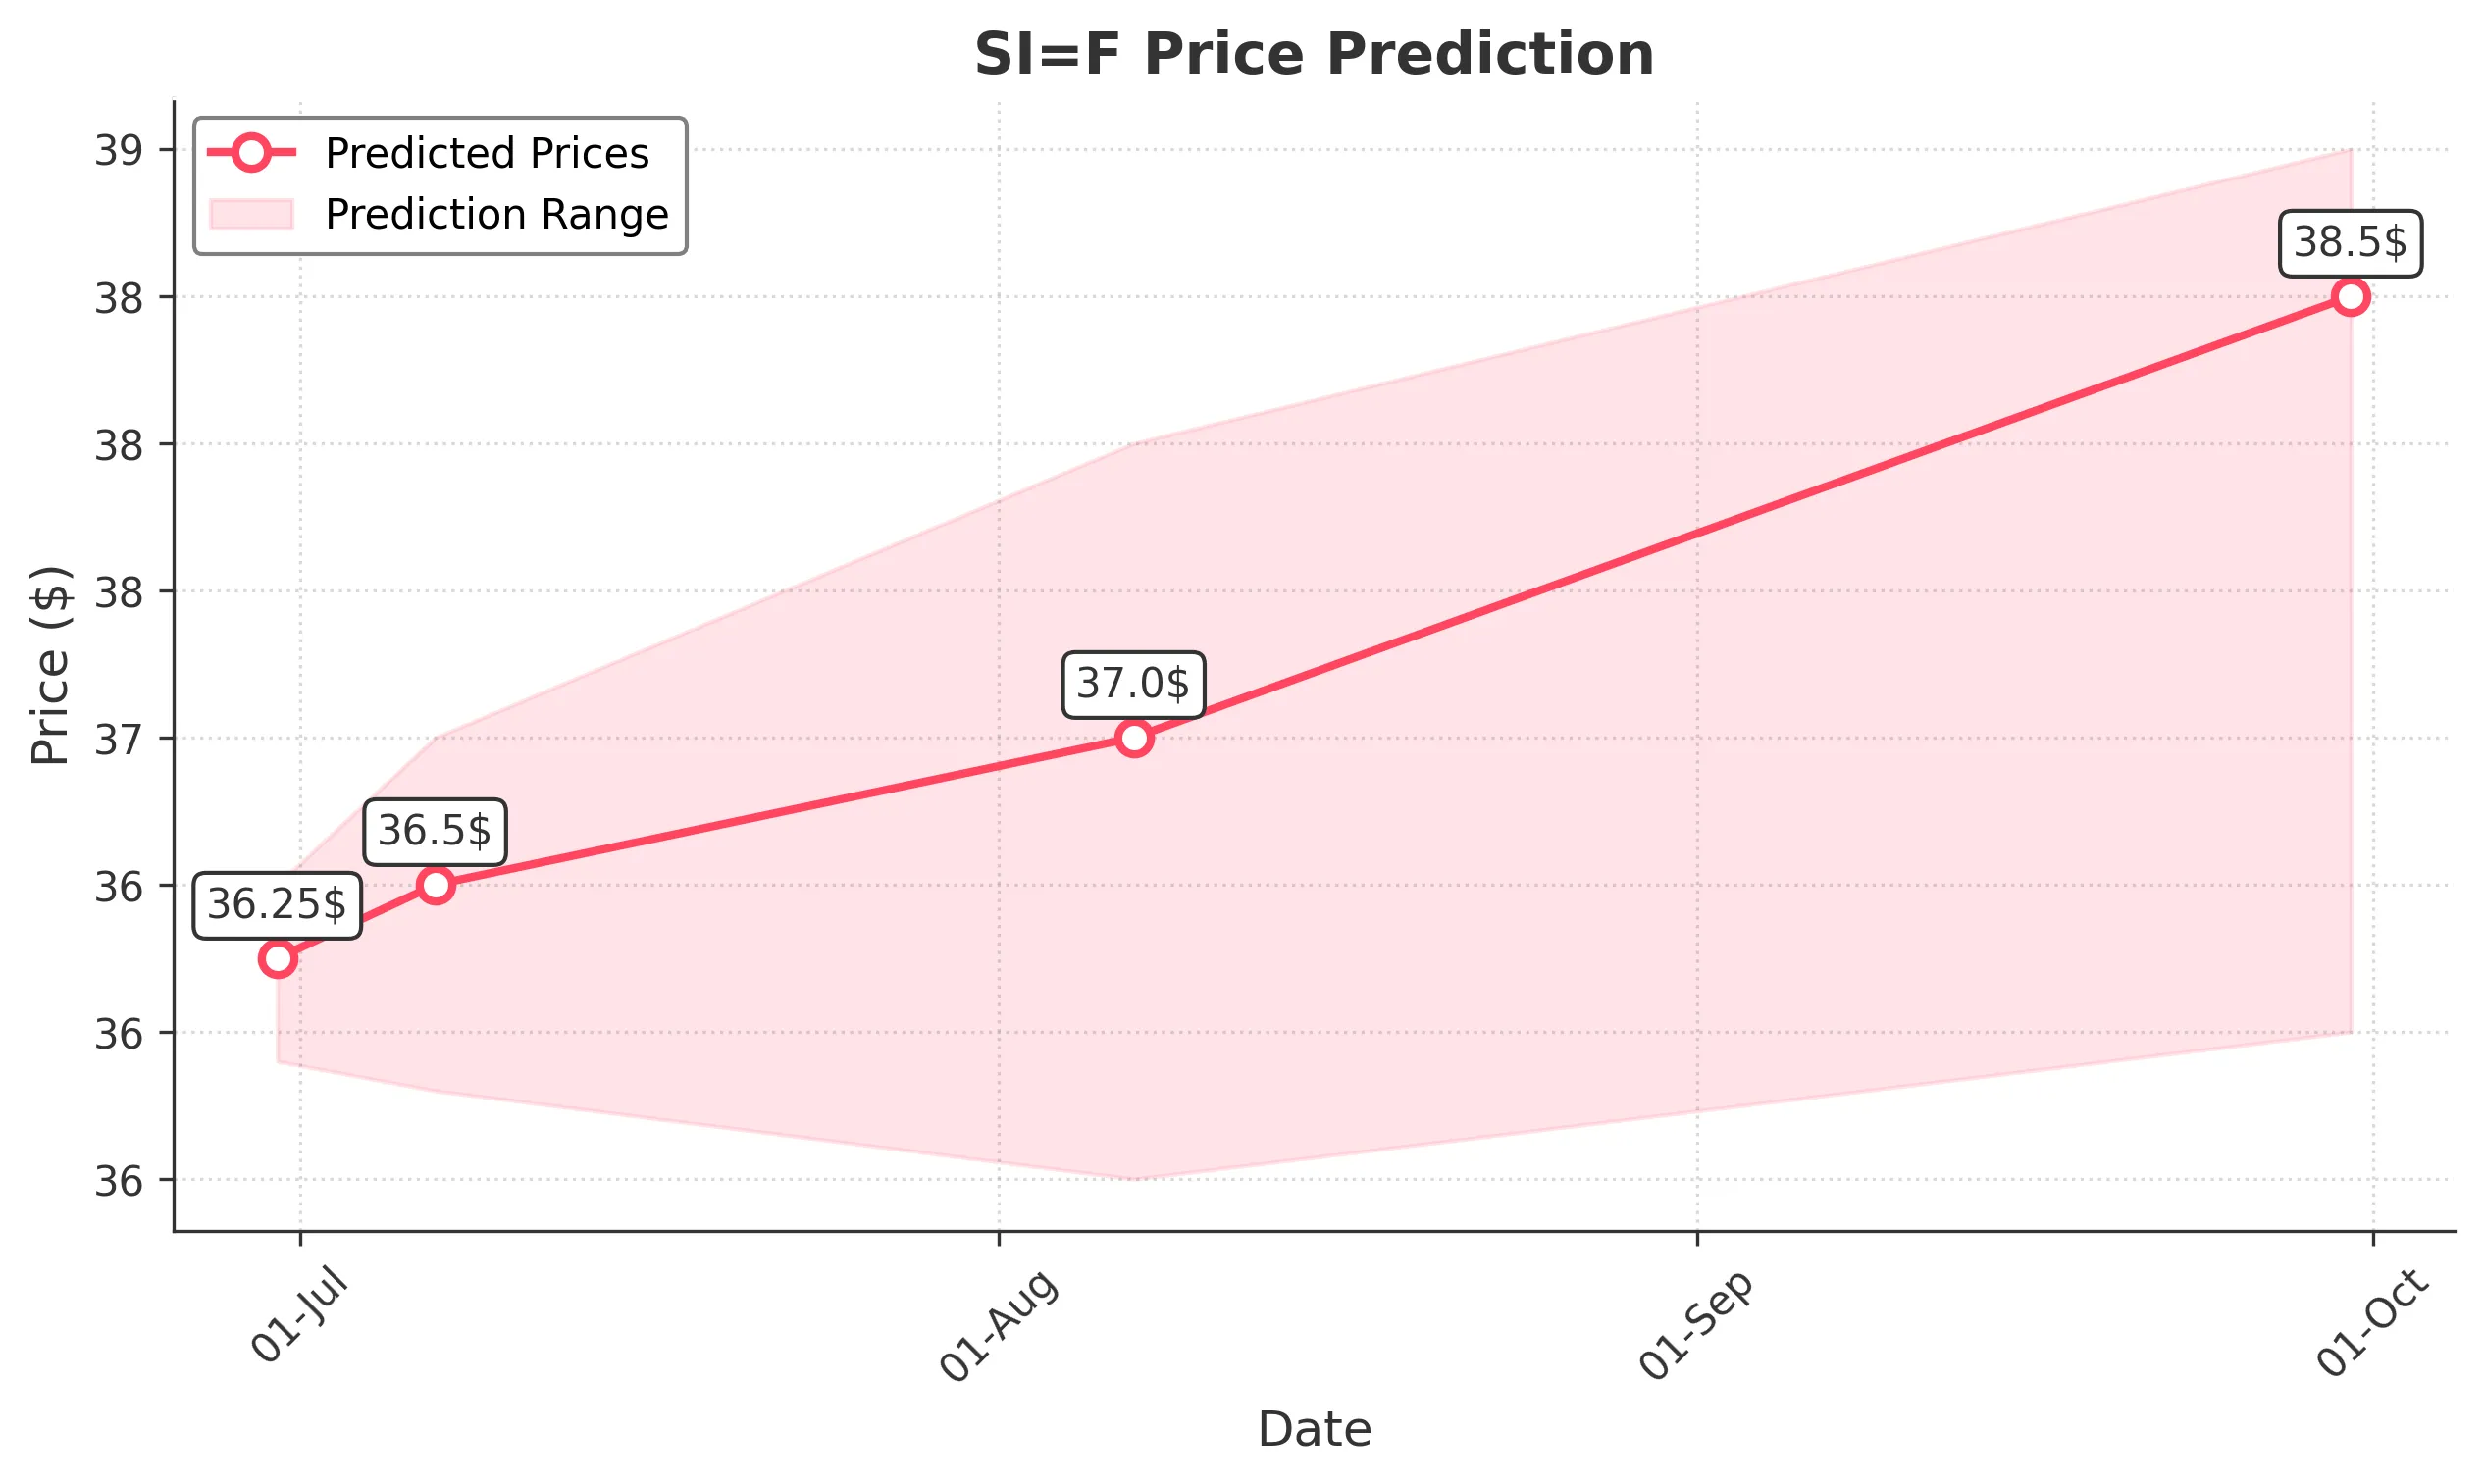
Target: June 30, 2025$36.25
$36.2
$36.5
$35.9
Description
The stock shows a bullish trend with a recent upward movement. The RSI is approaching overbought levels, indicating potential for a pullback. However, the MACD remains positive, suggesting continued upward momentum. Volume is stable, supporting the price action.
Analysis
Over the past 3 months, SI=F has shown a bullish trend, with significant support at 35.50 and resistance around 37.00. The MACD indicates upward momentum, while the RSI suggests caution as it nears overbought territory. Volume has been consistent, with spikes on upward days.
Confidence Level
Potential Risks
Potential market volatility and profit-taking could lead to a price correction.
1 Week Prediction
Target: July 7, 2025$36.5
$36.3
$37
$35.8
Description
The stock is expected to maintain its bullish trend, supported by recent price action and positive MACD. However, the RSI indicates potential overbought conditions, which may lead to short-term corrections. Volume trends suggest healthy trading activity.
Analysis
The stock has been in a bullish phase, with key support at 35.50 and resistance at 37.00. The recent price action shows strong buying interest, but the RSI nearing overbought levels raises concerns about potential pullbacks. Volume patterns indicate healthy trading.
Confidence Level
Potential Risks
Market sentiment could shift due to external economic factors, impacting the stock's performance.
1 Month Prediction
Target: August 7, 2025$37
$36.8
$38
$35.5
Description
The stock is likely to continue its upward trajectory, driven by strong fundamentals and positive market sentiment. However, the RSI suggests caution as it approaches overbought territory. A potential pullback could occur if profit-taking ensues.
Analysis
SI=F has shown a strong bullish trend with significant support at 35.50 and resistance at 37.00. The MACD remains positive, indicating upward momentum, while the RSI suggests caution. Volume patterns indicate healthy trading, but external factors could introduce volatility.
Confidence Level
Potential Risks
Unforeseen macroeconomic events could disrupt the current trend, leading to volatility.
3 Months Prediction
Target: September 30, 2025$38.5
$37.5
$39
$36
Description
The stock is expected to maintain a bullish trend over the next three months, supported by strong fundamentals. However, the RSI indicates potential overbought conditions, which may lead to corrections. Market sentiment remains positive, but external factors could introduce risks.
Analysis
Over the past three months, SI=F has demonstrated a bullish trend with key support at 36.00 and resistance at 39.00. The MACD indicates continued upward momentum, while the RSI suggests caution as it nears overbought levels. Volume patterns show healthy trading, but external economic factors could introduce volatility.
Confidence Level
Potential Risks
Market volatility and economic uncertainties could impact the stock's performance significantly.