SIF Trading Predictions
1 Day Prediction
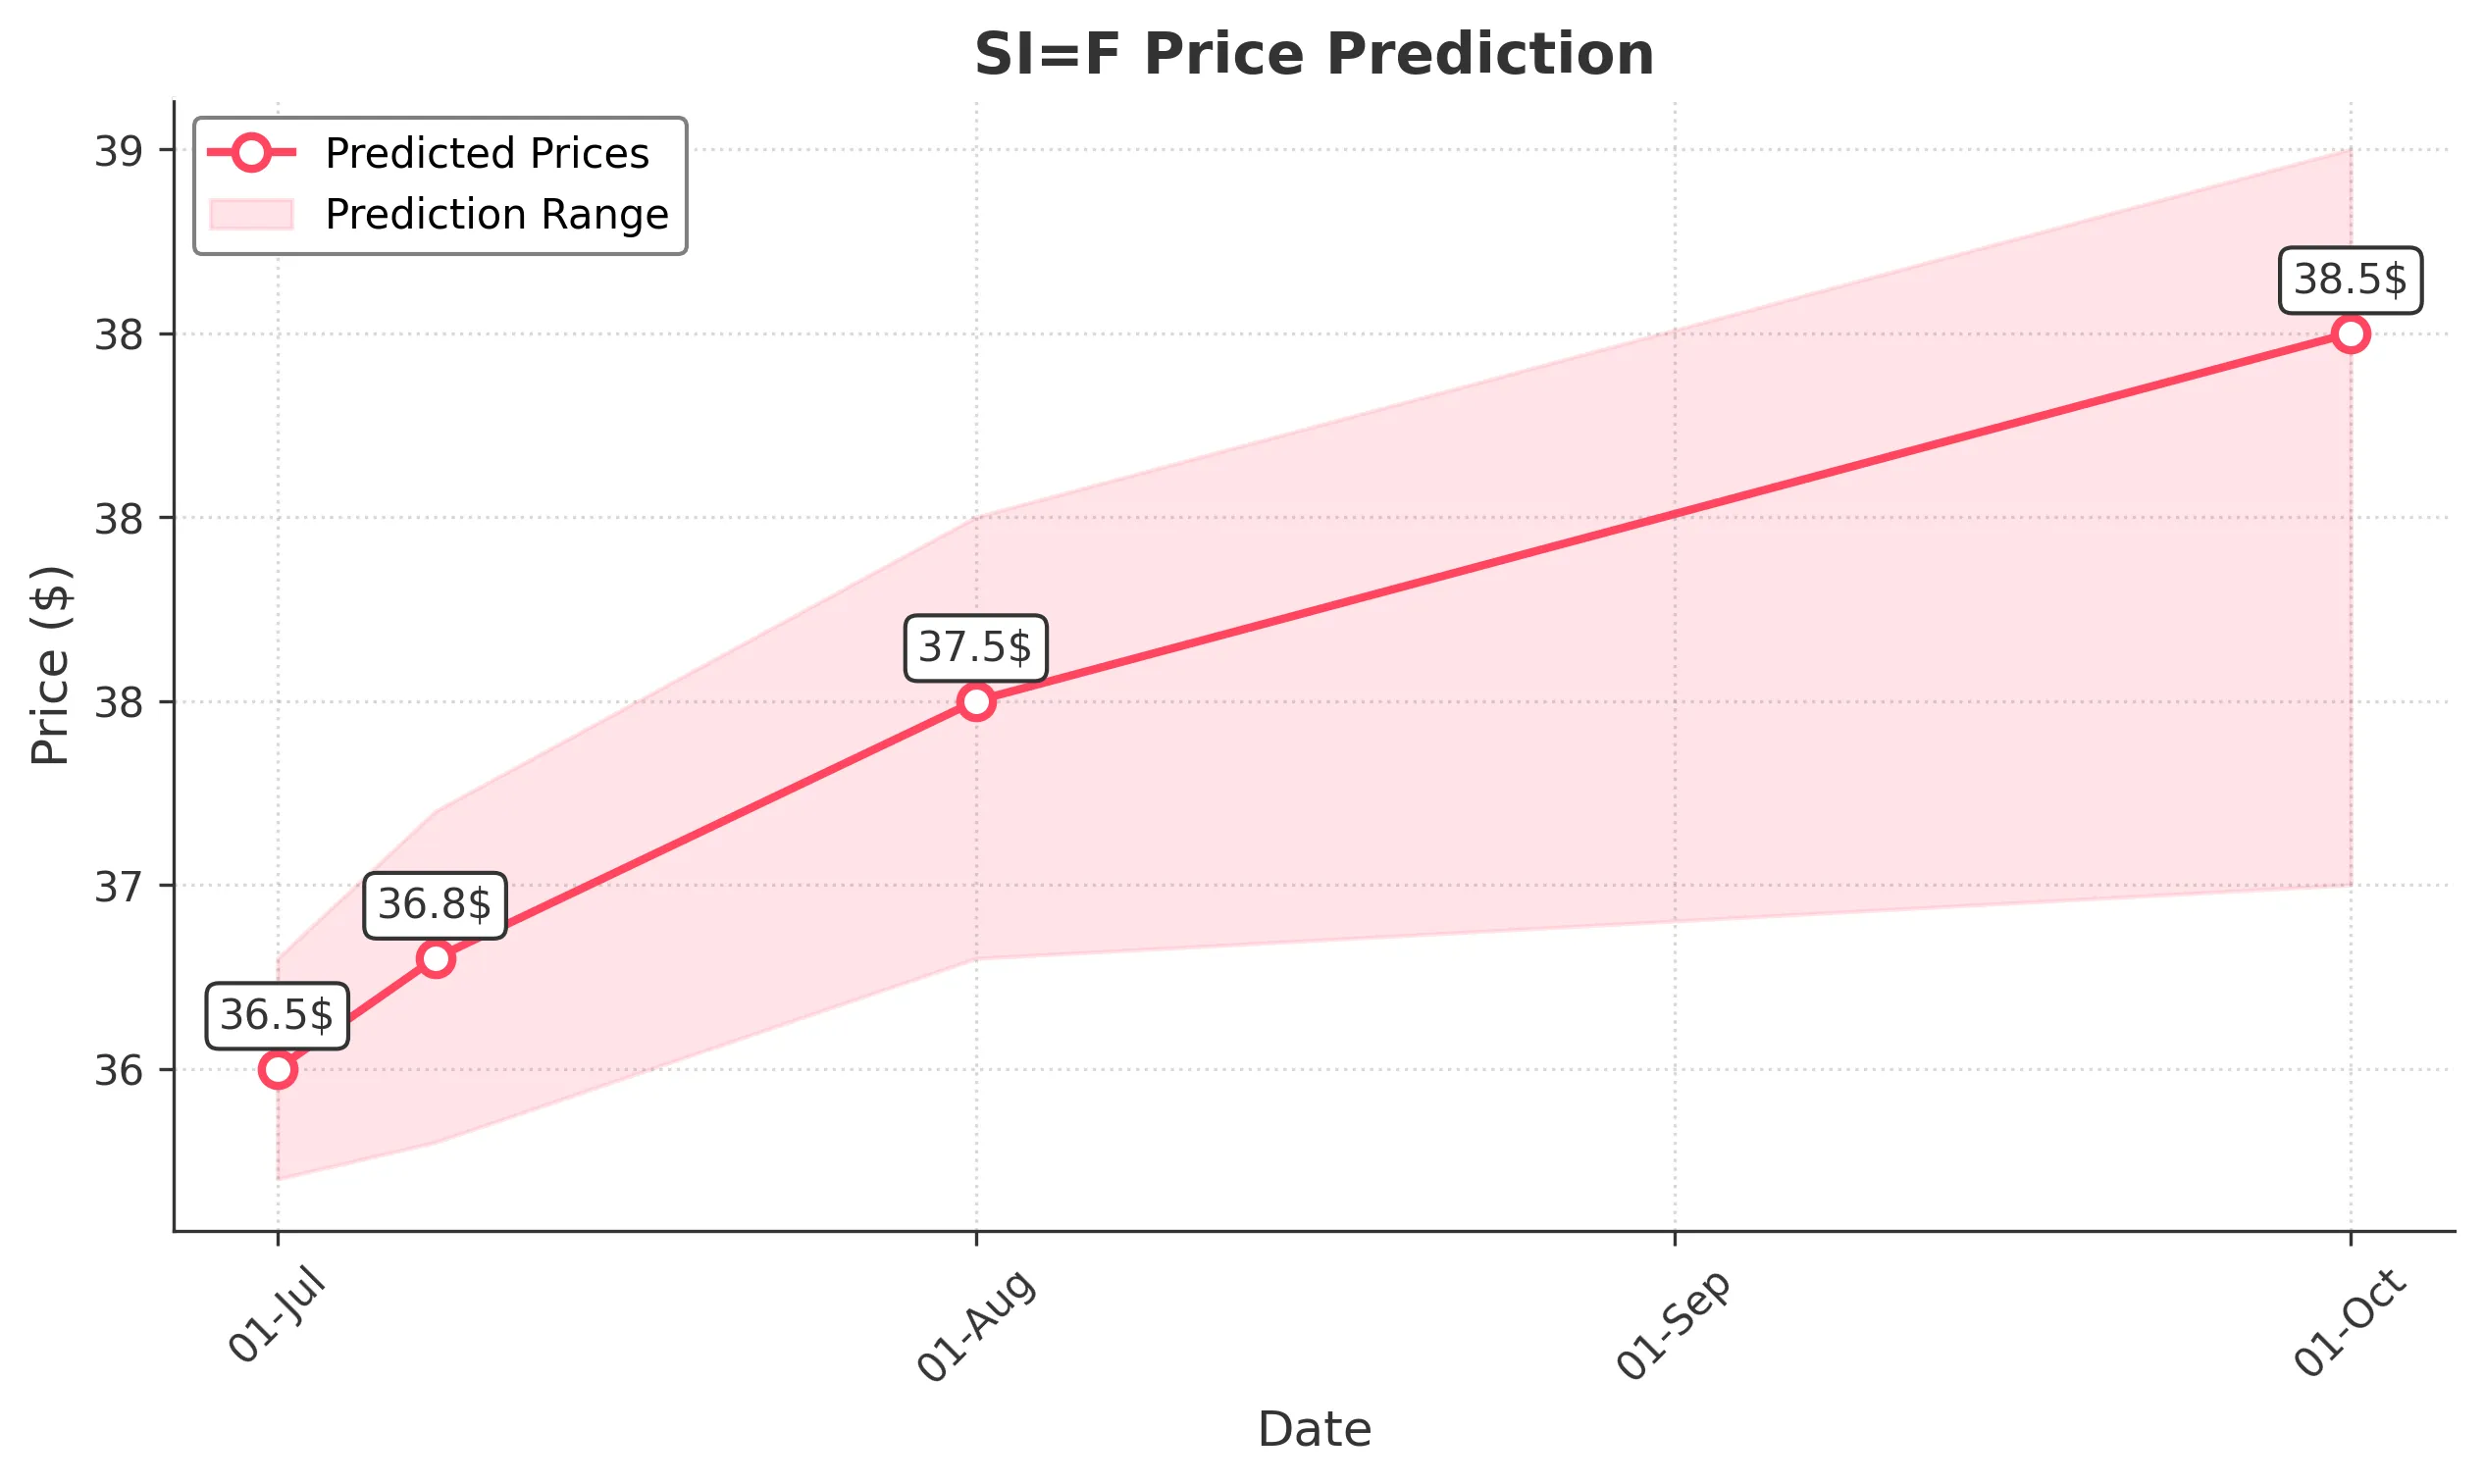
Target: July 1, 2025$36.5
$36.4
$36.8
$36.2
Description
The stock shows a bullish trend with a recent upward movement. The RSI is approaching overbought levels, indicating potential for a pullback. However, the MACD is positive, suggesting continued momentum. Expect slight fluctuations around the predicted close.
Analysis
Over the past 3 months, SI=F has shown a bullish trend, with significant support at 35.5 and resistance around 37.0. The recent price action indicates strong buying interest, but the RSI nearing overbought levels suggests caution. Volume has been stable, with occasional spikes indicating interest.
Confidence Level
Potential Risks
Potential market volatility and profit-taking could lead to unexpected price movements.
1 Week Prediction
Target: July 8, 2025$36.8
$36.6
$37.2
$36.3
Description
The stock is expected to maintain its upward trajectory, supported by positive market sentiment and technical indicators. The MACD remains bullish, and the price is likely to test resistance levels. Watch for potential pullbacks as the RSI approaches overbought.
Analysis
The stock has been in a bullish phase, with key support at 36.0 and resistance at 37.0. The MACD and moving averages indicate upward momentum, while volume patterns suggest sustained interest. However, the RSI indicates potential overbought conditions, warranting caution.
Confidence Level
Potential Risks
Market corrections or negative news could impact the stock's performance.
1 Month Prediction
Target: August 1, 2025$37.5
$36.9
$38
$36.8
Description
The stock is likely to continue its upward trend, driven by strong fundamentals and positive market sentiment. The MACD remains bullish, and the price may break through resistance levels. However, watch for potential corrections as the RSI approaches overbought.
Analysis
In the last three months, SI=F has shown a clear bullish trend, with significant support at 36.0 and resistance at 38.0. The MACD and moving averages support upward momentum, but the RSI indicates potential overbought conditions. Volume has been consistent, with occasional spikes.
Confidence Level
Potential Risks
External economic factors or earnings reports could lead to volatility.
3 Months Prediction
Target: October 1, 2025$38.5
$37.5
$39
$37
Description
The stock is expected to maintain a bullish trend, with potential for further gains as market conditions remain favorable. The MACD and moving averages support this outlook, but watch for potential corrections as the RSI approaches overbought levels.
Analysis
The stock has been on a bullish trend, with key support at 36.0 and resistance at 39.0. The MACD and moving averages indicate continued upward momentum, but the RSI suggests caution as it nears overbought territory. Volume patterns show consistent interest, but external factors could introduce volatility.
Confidence Level
Potential Risks
Market volatility and economic changes could impact the stock's trajectory.