SIF Trading Predictions
1 Day Prediction
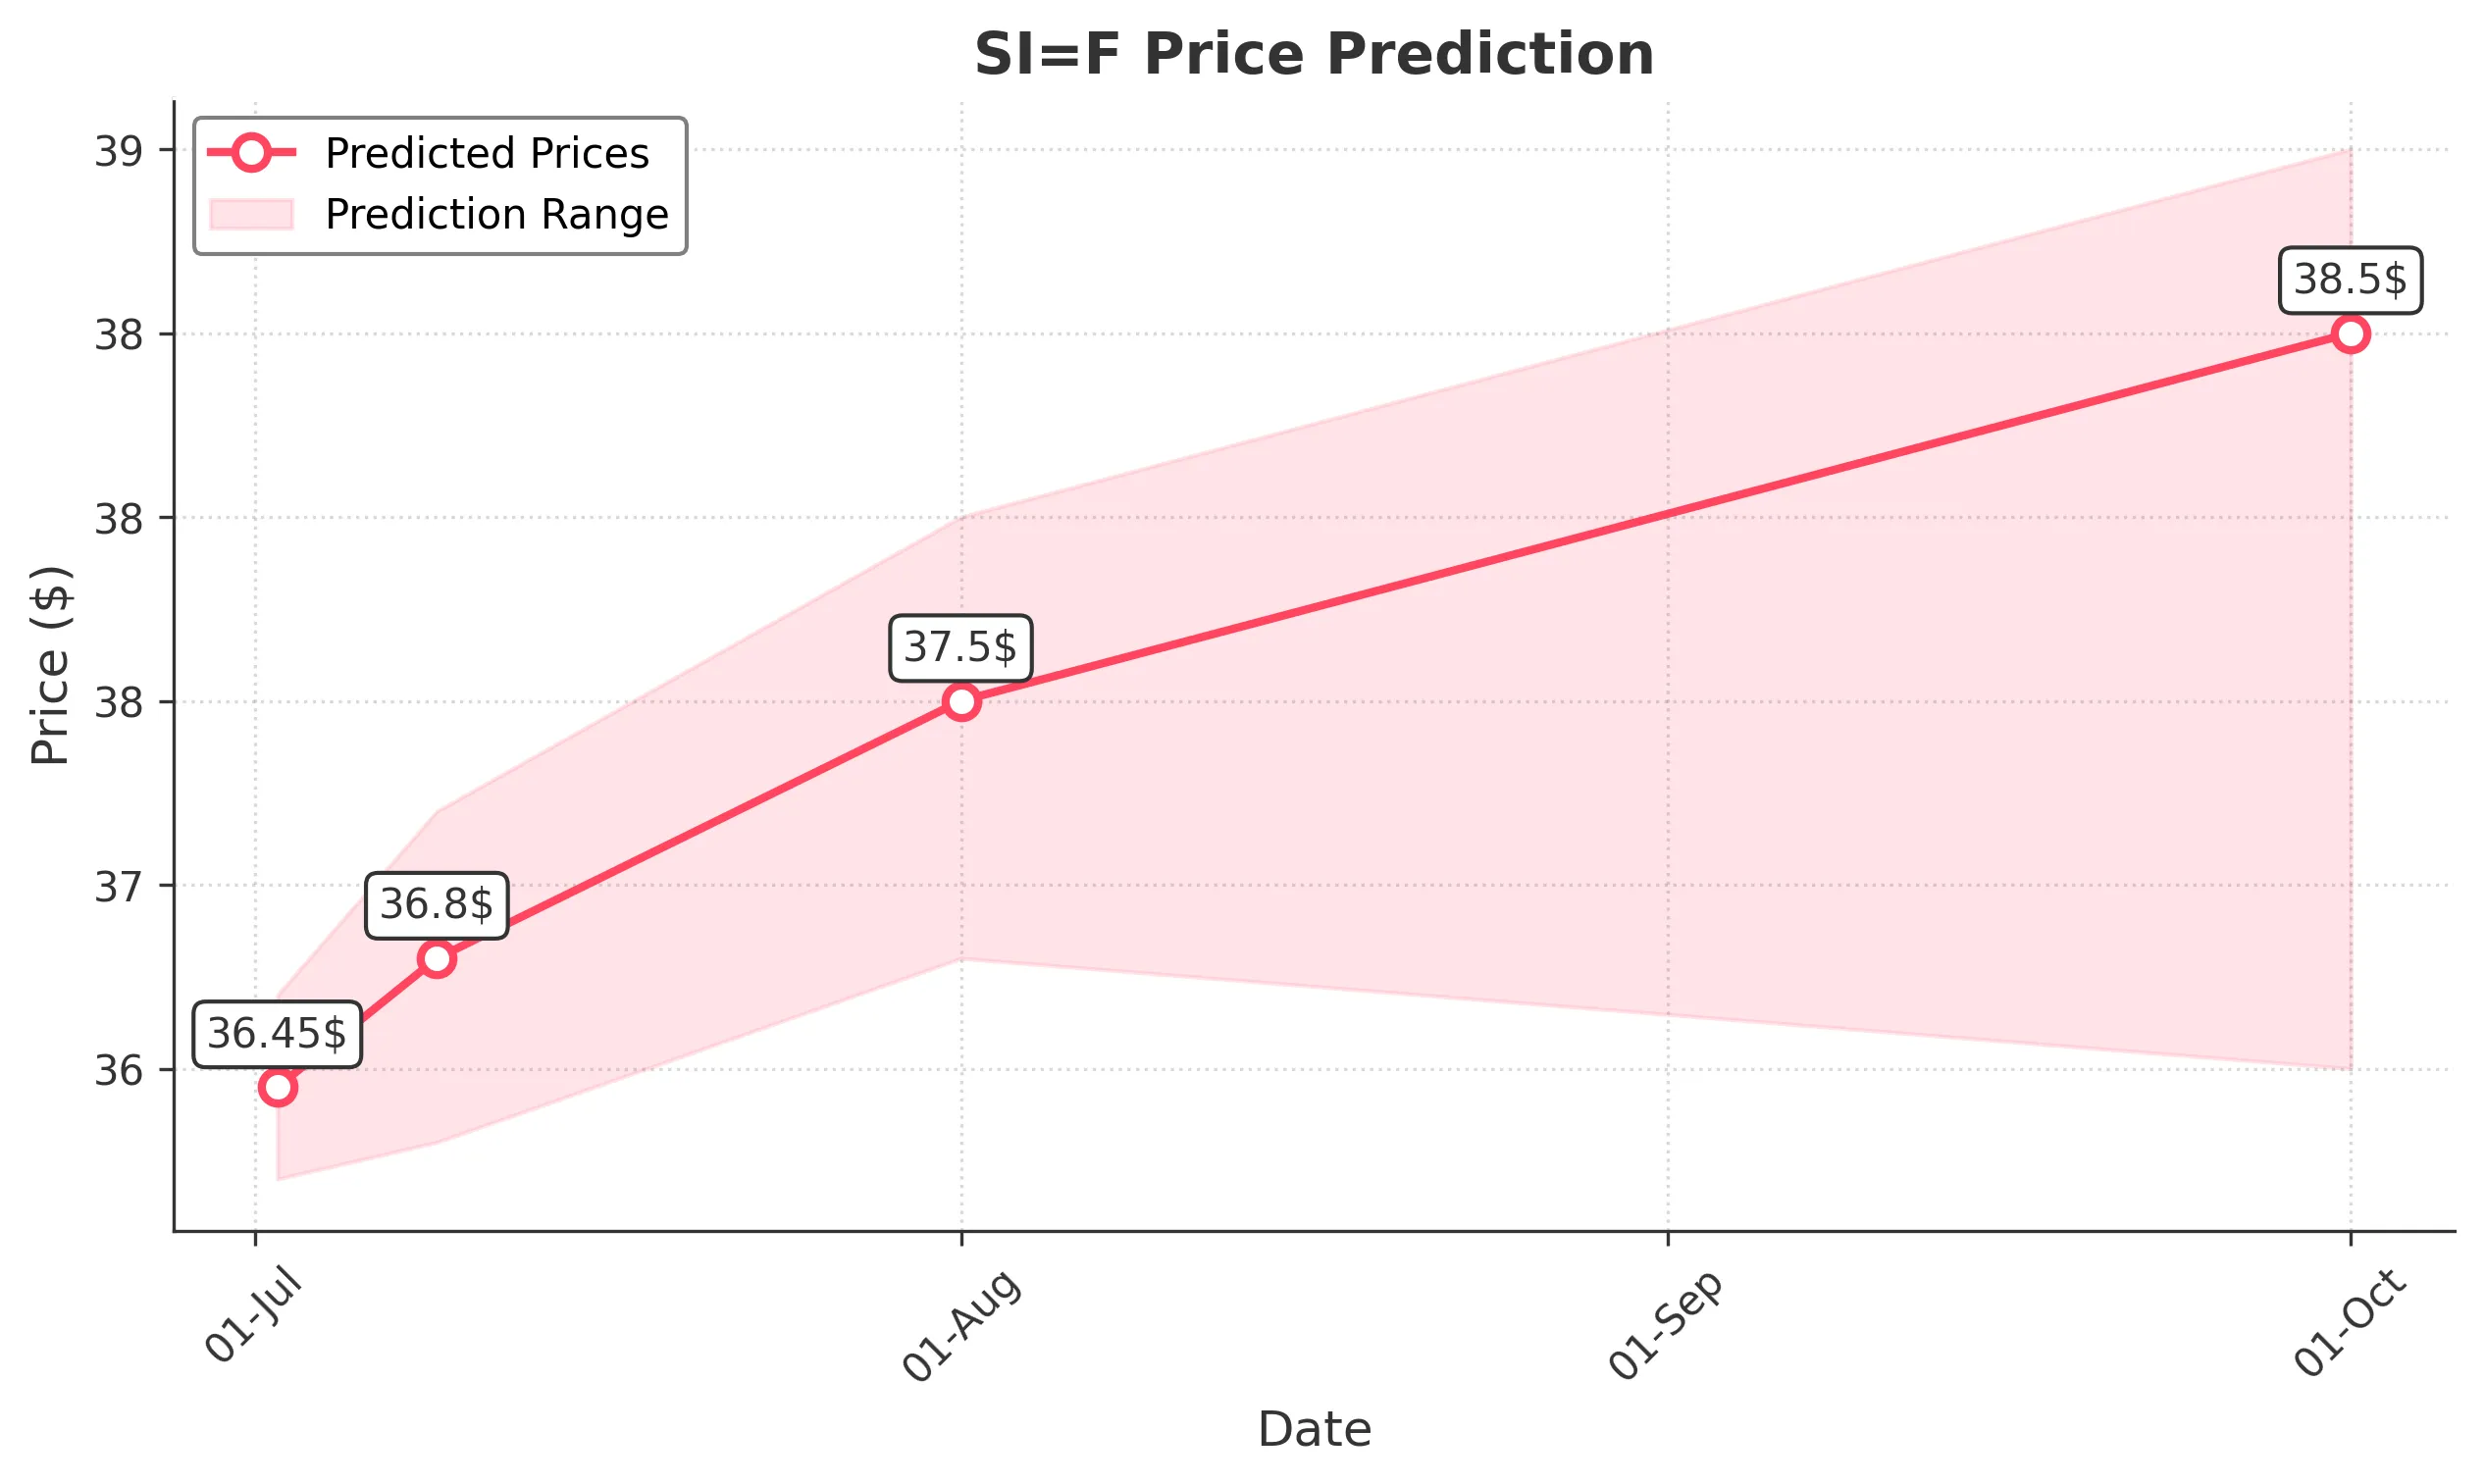
Target: July 2, 2025$36.45
$36.3
$36.7
$36.2
Description
The stock shows a bullish trend with a recent upward movement. The RSI is approaching overbought levels, indicating potential for a pullback. However, the MACD is positive, suggesting continued momentum. Volume is expected to increase slightly.
Analysis
Over the past 3 months, SI=F has shown a bullish trend with significant support at 35.00 and resistance around 37.00. The recent price action indicates a strong upward momentum, supported by positive MACD and RSI signals. However, volume spikes suggest caution as profit-taking may occur.
Confidence Level
Potential Risks
Potential market volatility and profit-taking could lead to a reversal.
1 Week Prediction
Target: July 9, 2025$36.8
$36.45
$37.2
$36.3
Description
The stock is expected to continue its upward trajectory, supported by bullish sentiment and strong technical indicators. The MACD remains positive, and the price is above the 50-day moving average, indicating a strong trend.
Analysis
The stock has been in a bullish phase, with key support at 35.00 and resistance at 37.00. The recent price movements indicate strong buying interest, but the RSI is nearing overbought territory, suggesting a potential pullback. Volume trends are increasing, indicating strong market interest.
Confidence Level
Potential Risks
Market corrections or negative news could impact the upward trend.
1 Month Prediction
Target: August 1, 2025$37.5
$36.9
$38
$36.8
Description
The stock is likely to reach new highs as bullish momentum continues. The MACD and RSI indicate strong upward movement, and the price is expected to break through resistance levels. Increased volume suggests strong buying interest.
Analysis
SI=F has shown a consistent upward trend, with significant support at 35.00 and resistance at 37.00. The technical indicators suggest a continuation of the bullish trend, but caution is warranted as the RSI approaches overbought levels. Volume patterns indicate strong interest, but market sentiment could shift.
Confidence Level
Potential Risks
External market factors or economic data releases could lead to volatility.
3 Months Prediction
Target: October 1, 2025$38.5
$37
$39
$36.5
Description
The stock is expected to maintain its bullish trend, potentially reaching new highs. The technical indicators support continued upward movement, but market sentiment and external factors could introduce volatility.
Analysis
Over the past three months, SI=F has demonstrated a strong bullish trend, with key support at 35.00 and resistance at 39.00. The MACD and RSI indicate positive momentum, but the potential for market corrections exists. Volume trends suggest strong interest, but external factors could impact performance.
Confidence Level
Potential Risks
Economic conditions and market sentiment could lead to unexpected downturns.