SIF Trading Predictions
1 Day Prediction
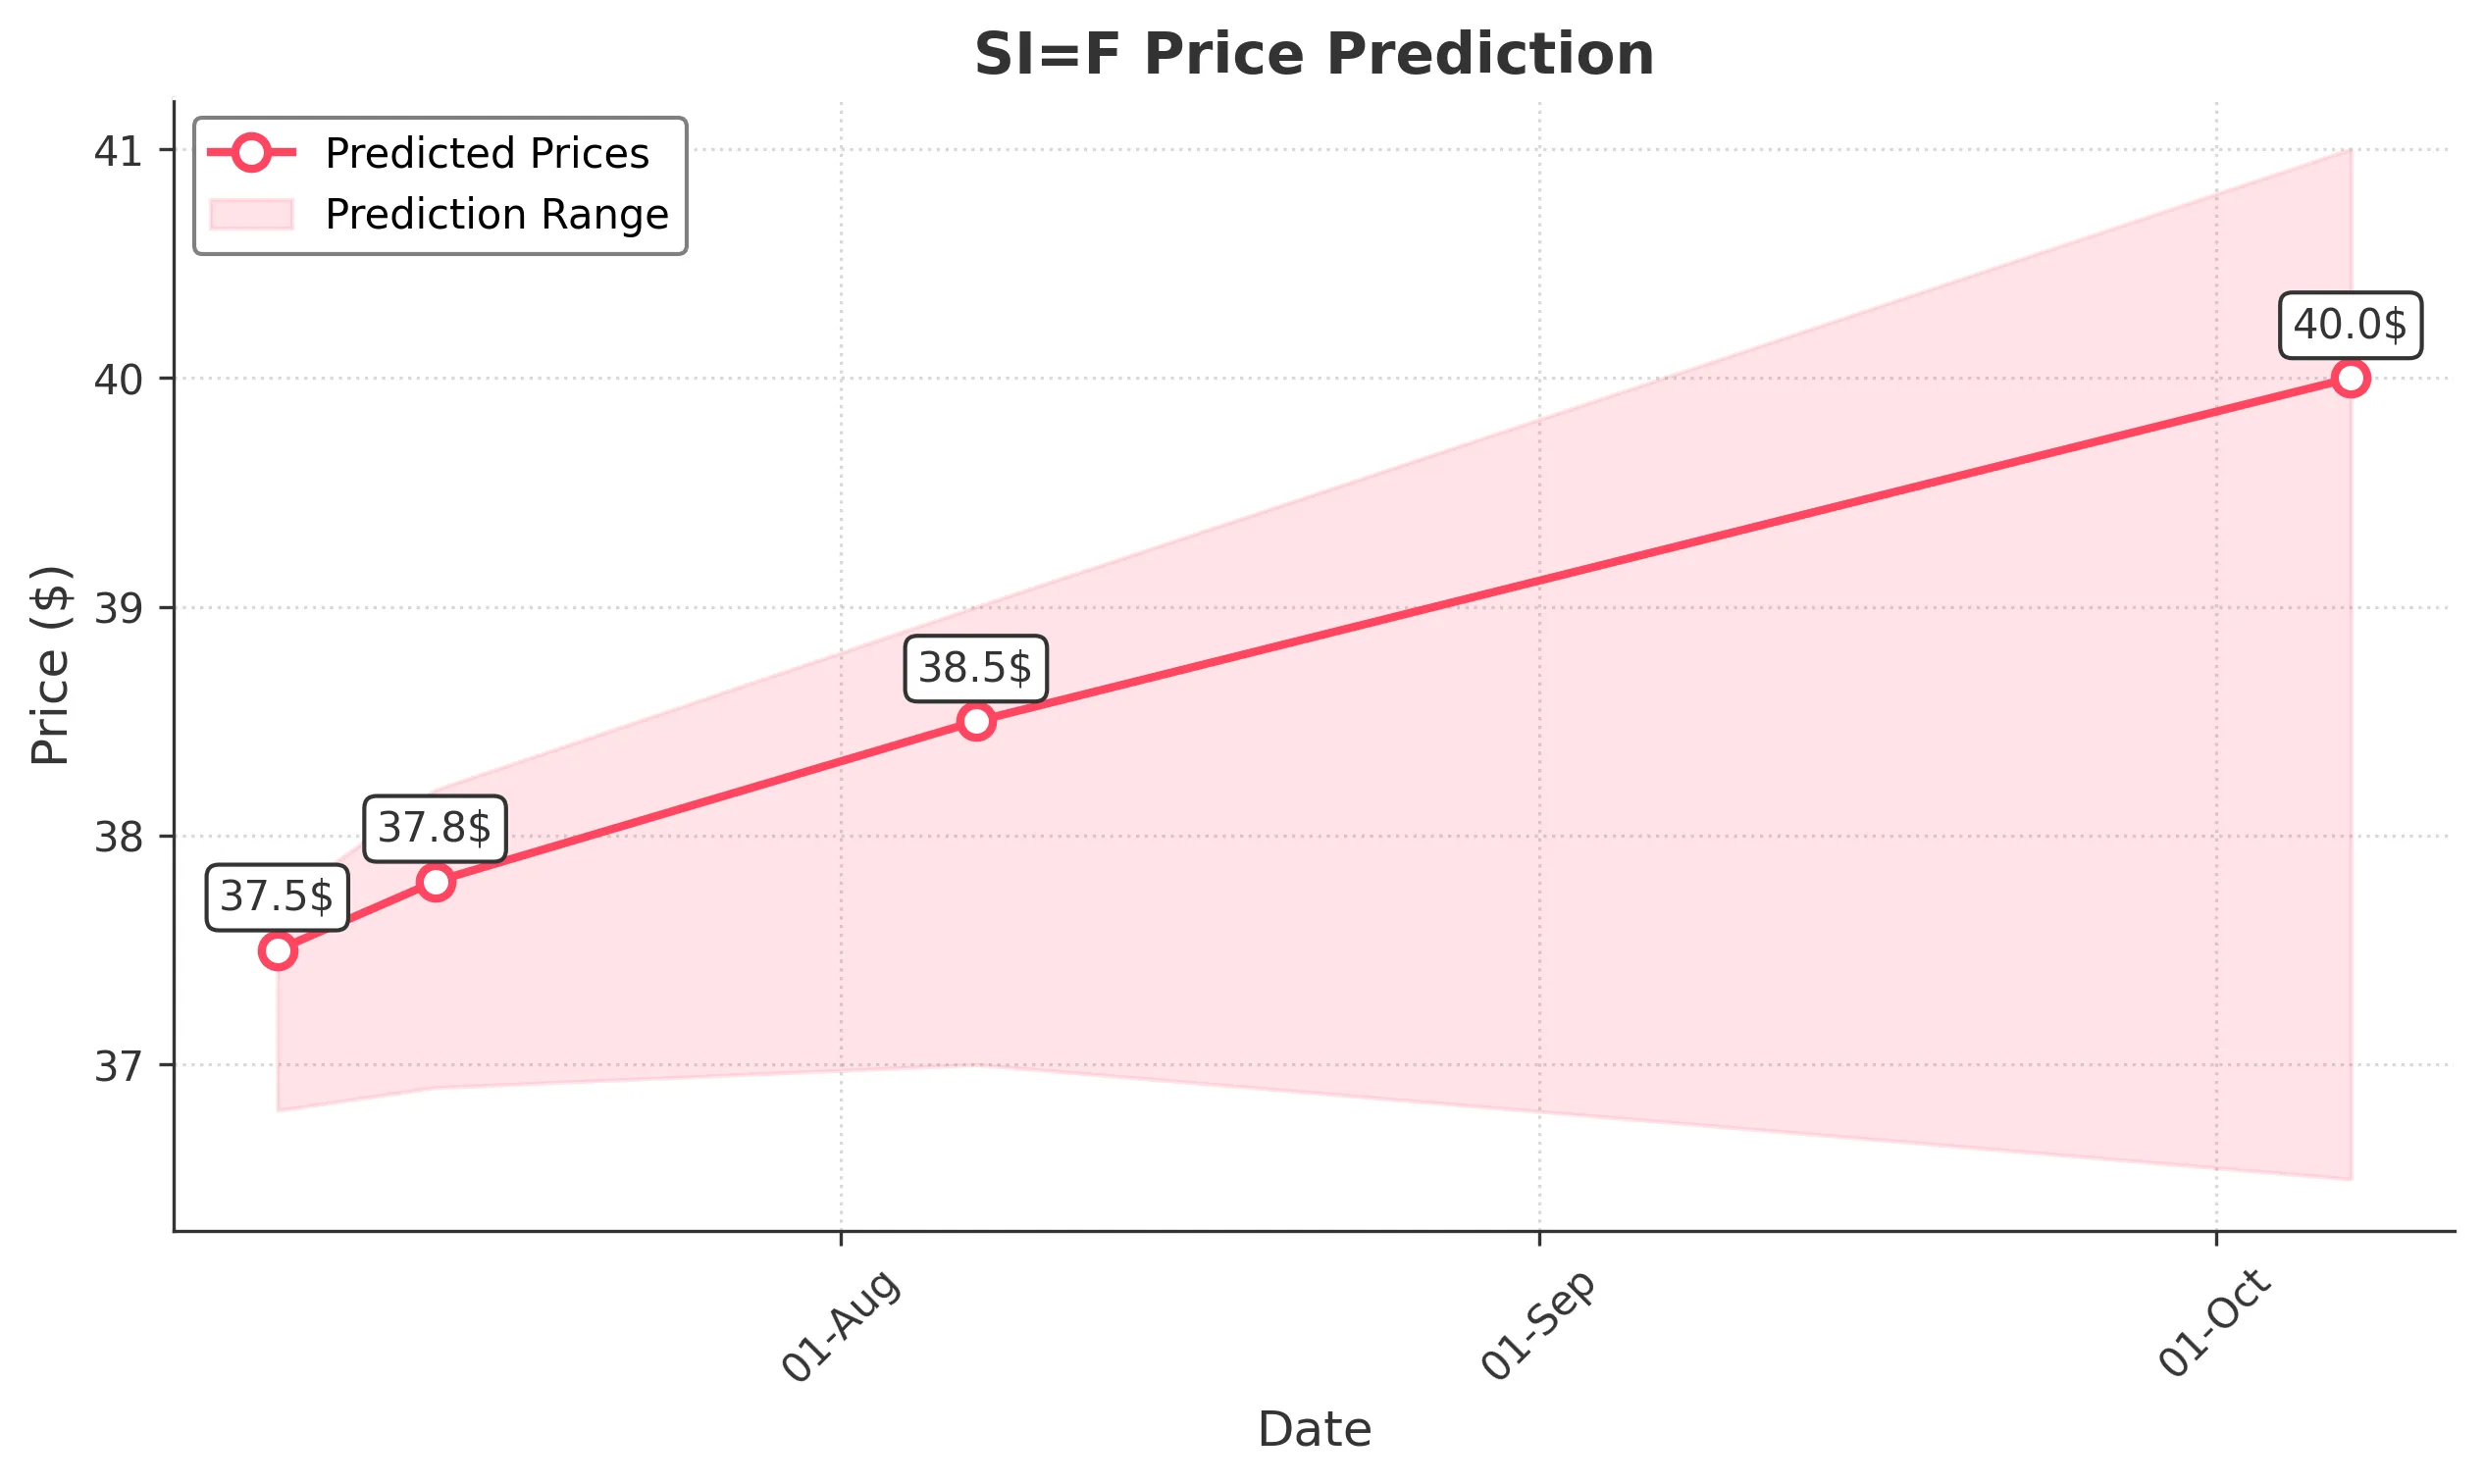
Target: July 7, 2025$37.5
$37.2
$37.7
$36.8
Description
The stock shows bullish momentum with a recent upward trend. The RSI is approaching overbought levels, indicating potential for a pullback. However, strong support at 36.800 suggests limited downside risk. Expect a close around 37.500.
Analysis
Over the past 3 months, SI=F has shown a bullish trend, with significant support at 36.800 and resistance around 37.700. The MACD indicates upward momentum, while volume has been stable. Recent candlestick patterns suggest continued strength, but watch for volatility.
Confidence Level
Potential Risks
Potential for a short-term pullback if market sentiment shifts or if external news impacts trading.
1 Week Prediction
Target: July 14, 2025$37.8
$37.5
$38.2
$36.9
Description
The stock is expected to continue its upward trajectory, supported by strong buying interest. The Bollinger Bands indicate potential for further price expansion. However, the RSI suggests caution as it nears overbought territory.
Analysis
The stock has maintained a bullish trend with key support at 36.900. The MACD remains positive, and volume patterns indicate healthy trading activity. Watch for potential resistance at 38.200, which could trigger profit-taking.
Confidence Level
Potential Risks
Market volatility and external economic factors could lead to unexpected price movements.
1 Month Prediction
Target: August 7, 2025$38.5
$37.8
$39
$37
Description
The stock is likely to reach new highs as bullish sentiment persists. Fibonacci retracement levels suggest a target around 38.500. However, the RSI indicates potential overbought conditions, which may lead to corrections.
Analysis
SI=F has shown strong upward momentum, with significant resistance at 39.000. The MACD and moving averages support continued growth, but the RSI indicates caution. Volume trends are healthy, but external factors could introduce volatility.
Confidence Level
Potential Risks
Possible market corrections or negative news could impact the bullish outlook.
3 Months Prediction
Target: October 7, 2025$40
$38.5
$41
$36.5
Description
Long-term bullish outlook as the stock is expected to break through key resistance levels. However, potential market corrections could lead to volatility. Watch for external economic indicators that may influence sentiment.
Analysis
The stock has shown a strong bullish trend, with key support at 36.500 and resistance at 41.000. The MACD indicates continued upward momentum, but the RSI suggests caution. Volume patterns are stable, but external factors could introduce uncertainty.
Confidence Level
Potential Risks
Unforeseen macroeconomic events or shifts in market sentiment could lead to significant price fluctuations.