SIF Trading Predictions
1 Day Prediction
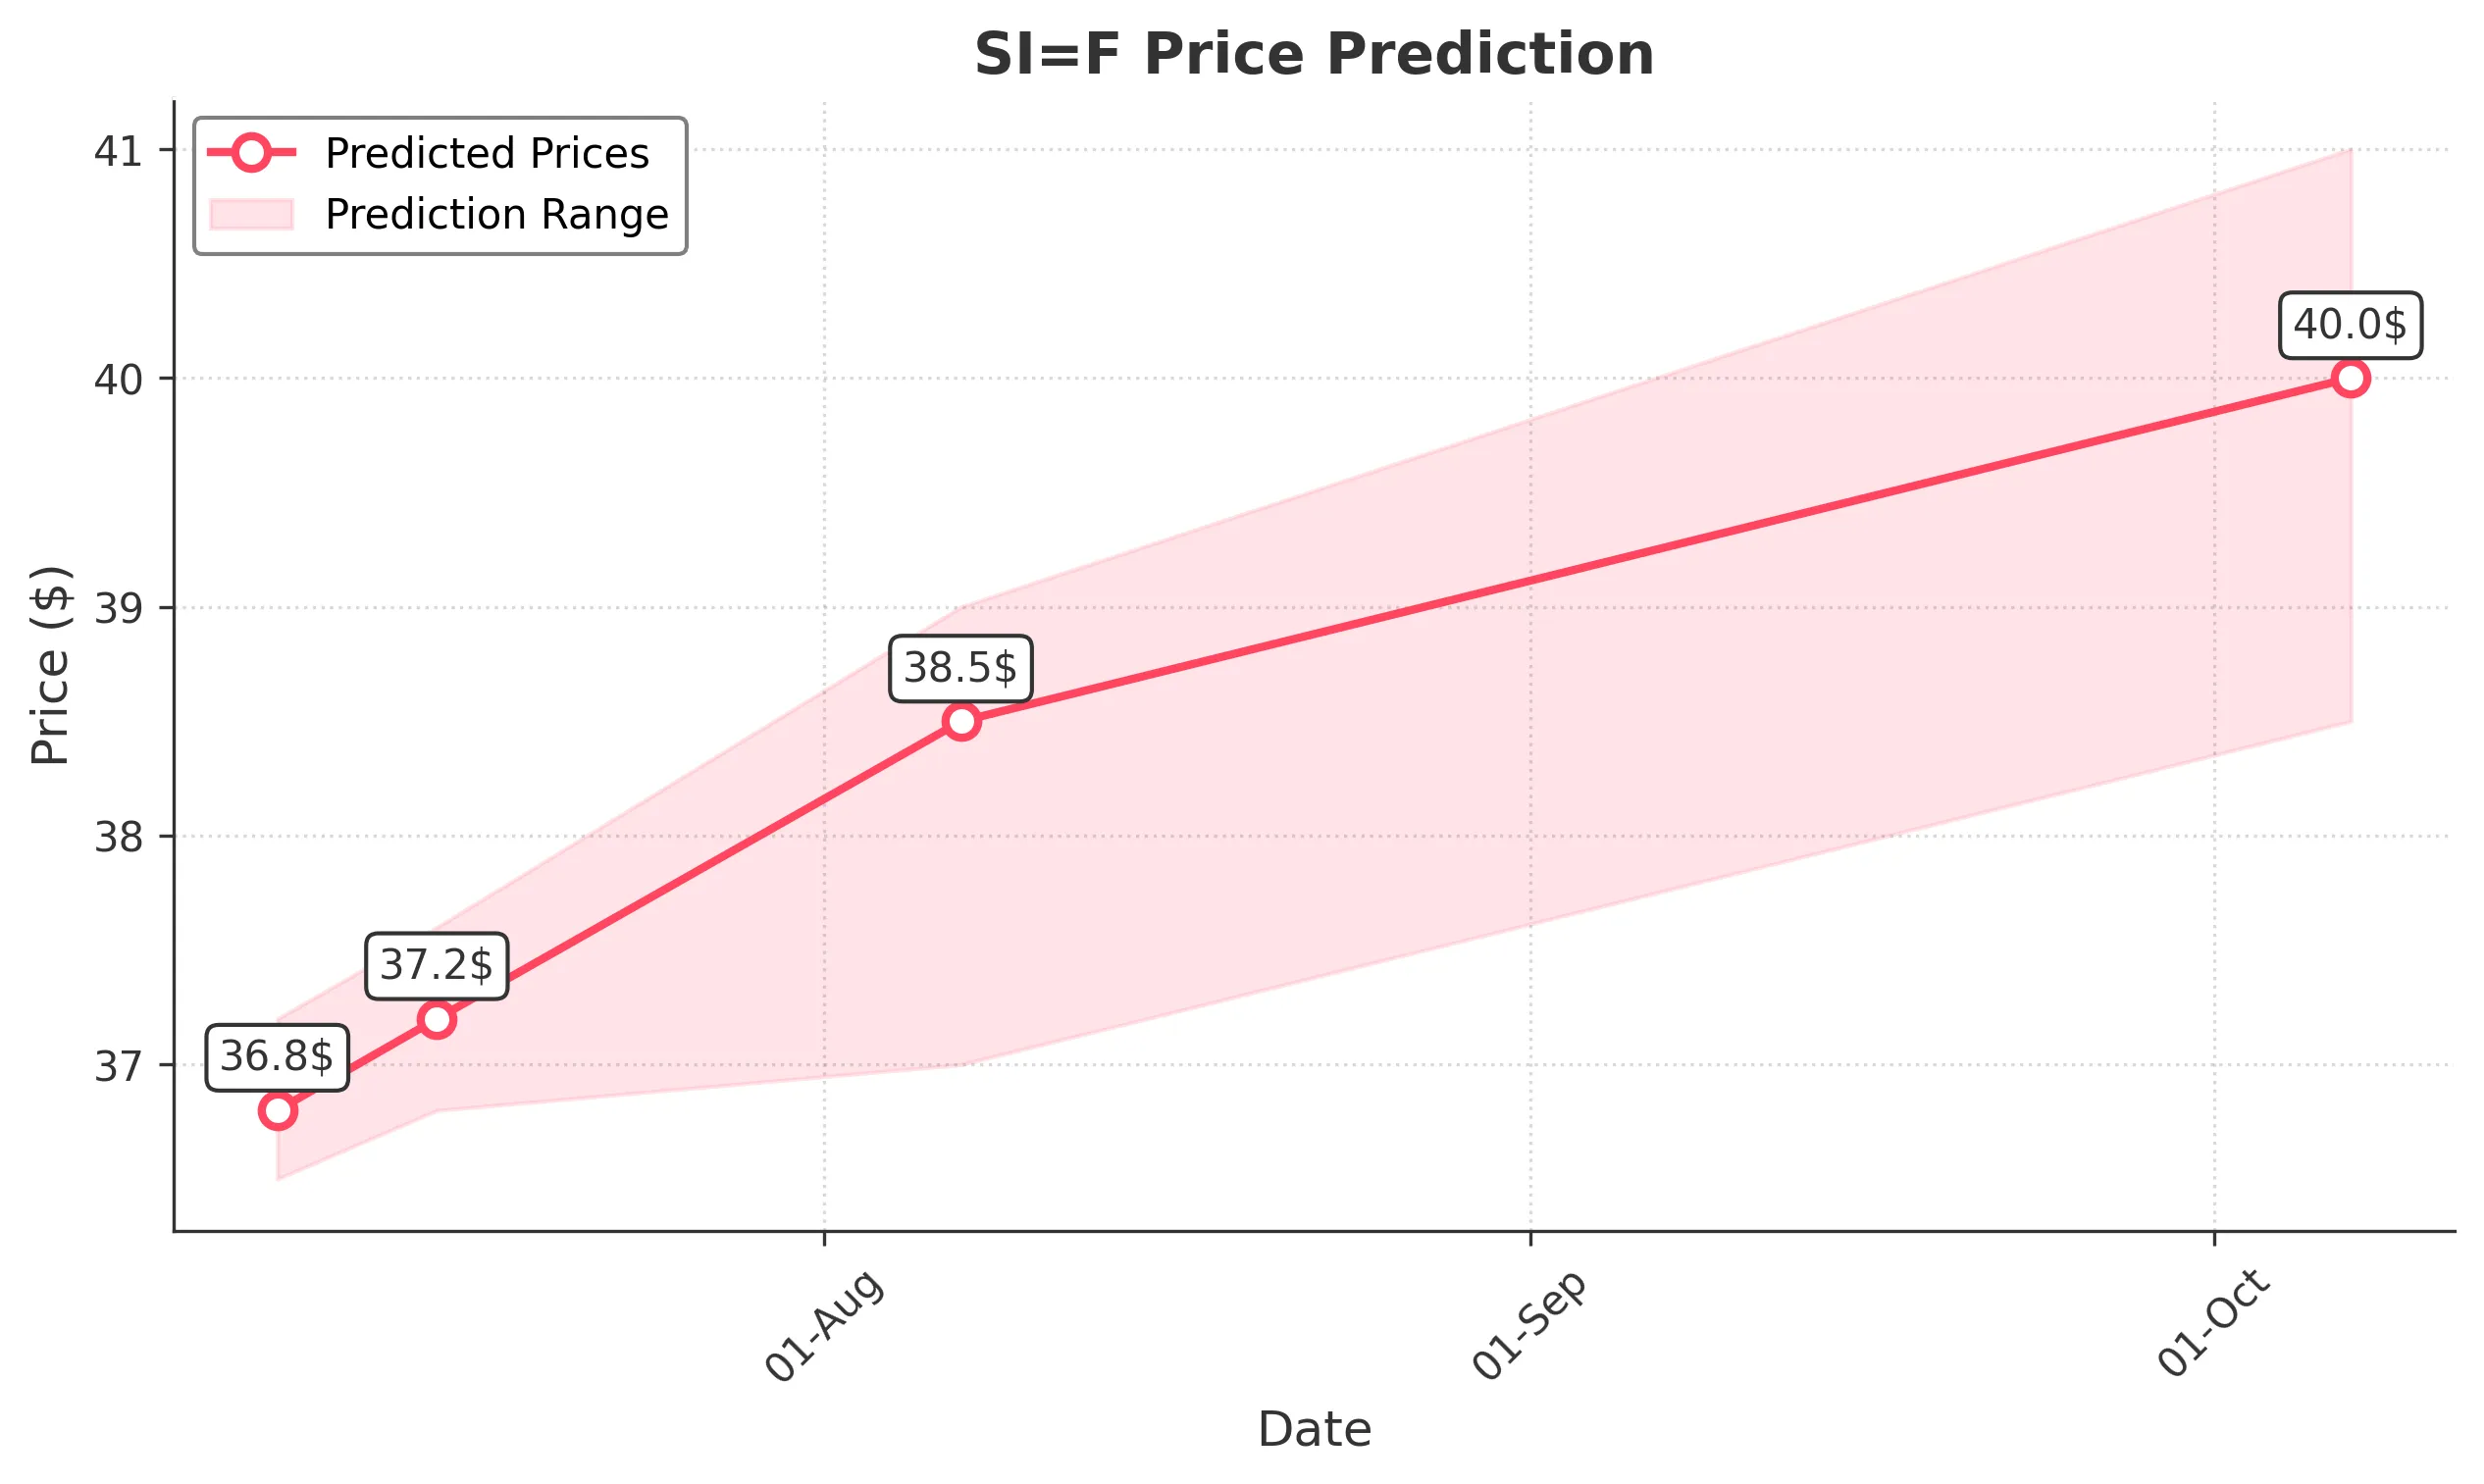
Target: July 8, 2025$36.8
$36.75
$37.2
$36.5
Description
The stock shows a bullish trend with a recent upward movement. The RSI is approaching overbought levels, indicating potential for a pullback. However, the MACD is positive, suggesting continued momentum. Expect slight volatility due to market sentiment.
Analysis
Over the past 3 months, SI=F has shown a bullish trend, with significant support at 36.00 and resistance around 37.00. The MACD indicates upward momentum, while the RSI suggests caution as it nears overbought territory. Volume has been stable, with occasional spikes.
Confidence Level
Potential Risks
Potential for a reversal if market sentiment shifts or if external news impacts trading.
1 Week Prediction
Target: July 15, 2025$37.2
$36.9
$37.6
$36.8
Description
The stock is expected to continue its upward trajectory, supported by strong bullish momentum. The recent candlestick patterns indicate buying pressure. However, watch for potential resistance at 37.50, which could limit gains.
Analysis
The stock has been in a bullish phase, with key support at 36.00 and resistance at 37.50. The MACD remains positive, and the RSI is approaching overbought levels. Volume trends suggest healthy interest, but caution is warranted as the stock approaches resistance.
Confidence Level
Potential Risks
Market volatility and external economic factors could impact the stock's performance.
1 Month Prediction
Target: August 7, 2025$38.5
$37.8
$39
$37
Description
The stock is likely to break through resistance levels, driven by positive market sentiment and strong technical indicators. The bullish trend is supported by increasing volume and favorable candlestick patterns.
Analysis
SI=F has shown consistent upward movement, with a bullish trend supported by strong volume. Key resistance at 38.00 may be tested. The MACD is bullish, but the RSI indicates potential overbought conditions, suggesting a need for caution.
Confidence Level
Potential Risks
Economic data releases and geopolitical events could introduce volatility.
3 Months Prediction
Target: October 7, 2025$40
$39
$41
$38.5
Description
Long-term bullish sentiment is expected to drive the stock higher, with potential for new highs. However, market corrections may occur, and external factors could influence price movements.
Analysis
The stock has maintained a bullish trend, with key support at 38.00 and resistance at 40.00. The MACD remains positive, but the RSI indicates potential overbought conditions. Volume patterns suggest healthy interest, but caution is advised as the market evolves.
Confidence Level
Potential Risks
Unforeseen market events or economic downturns could lead to significant price corrections.