SIF Trading Predictions
1 Day Prediction
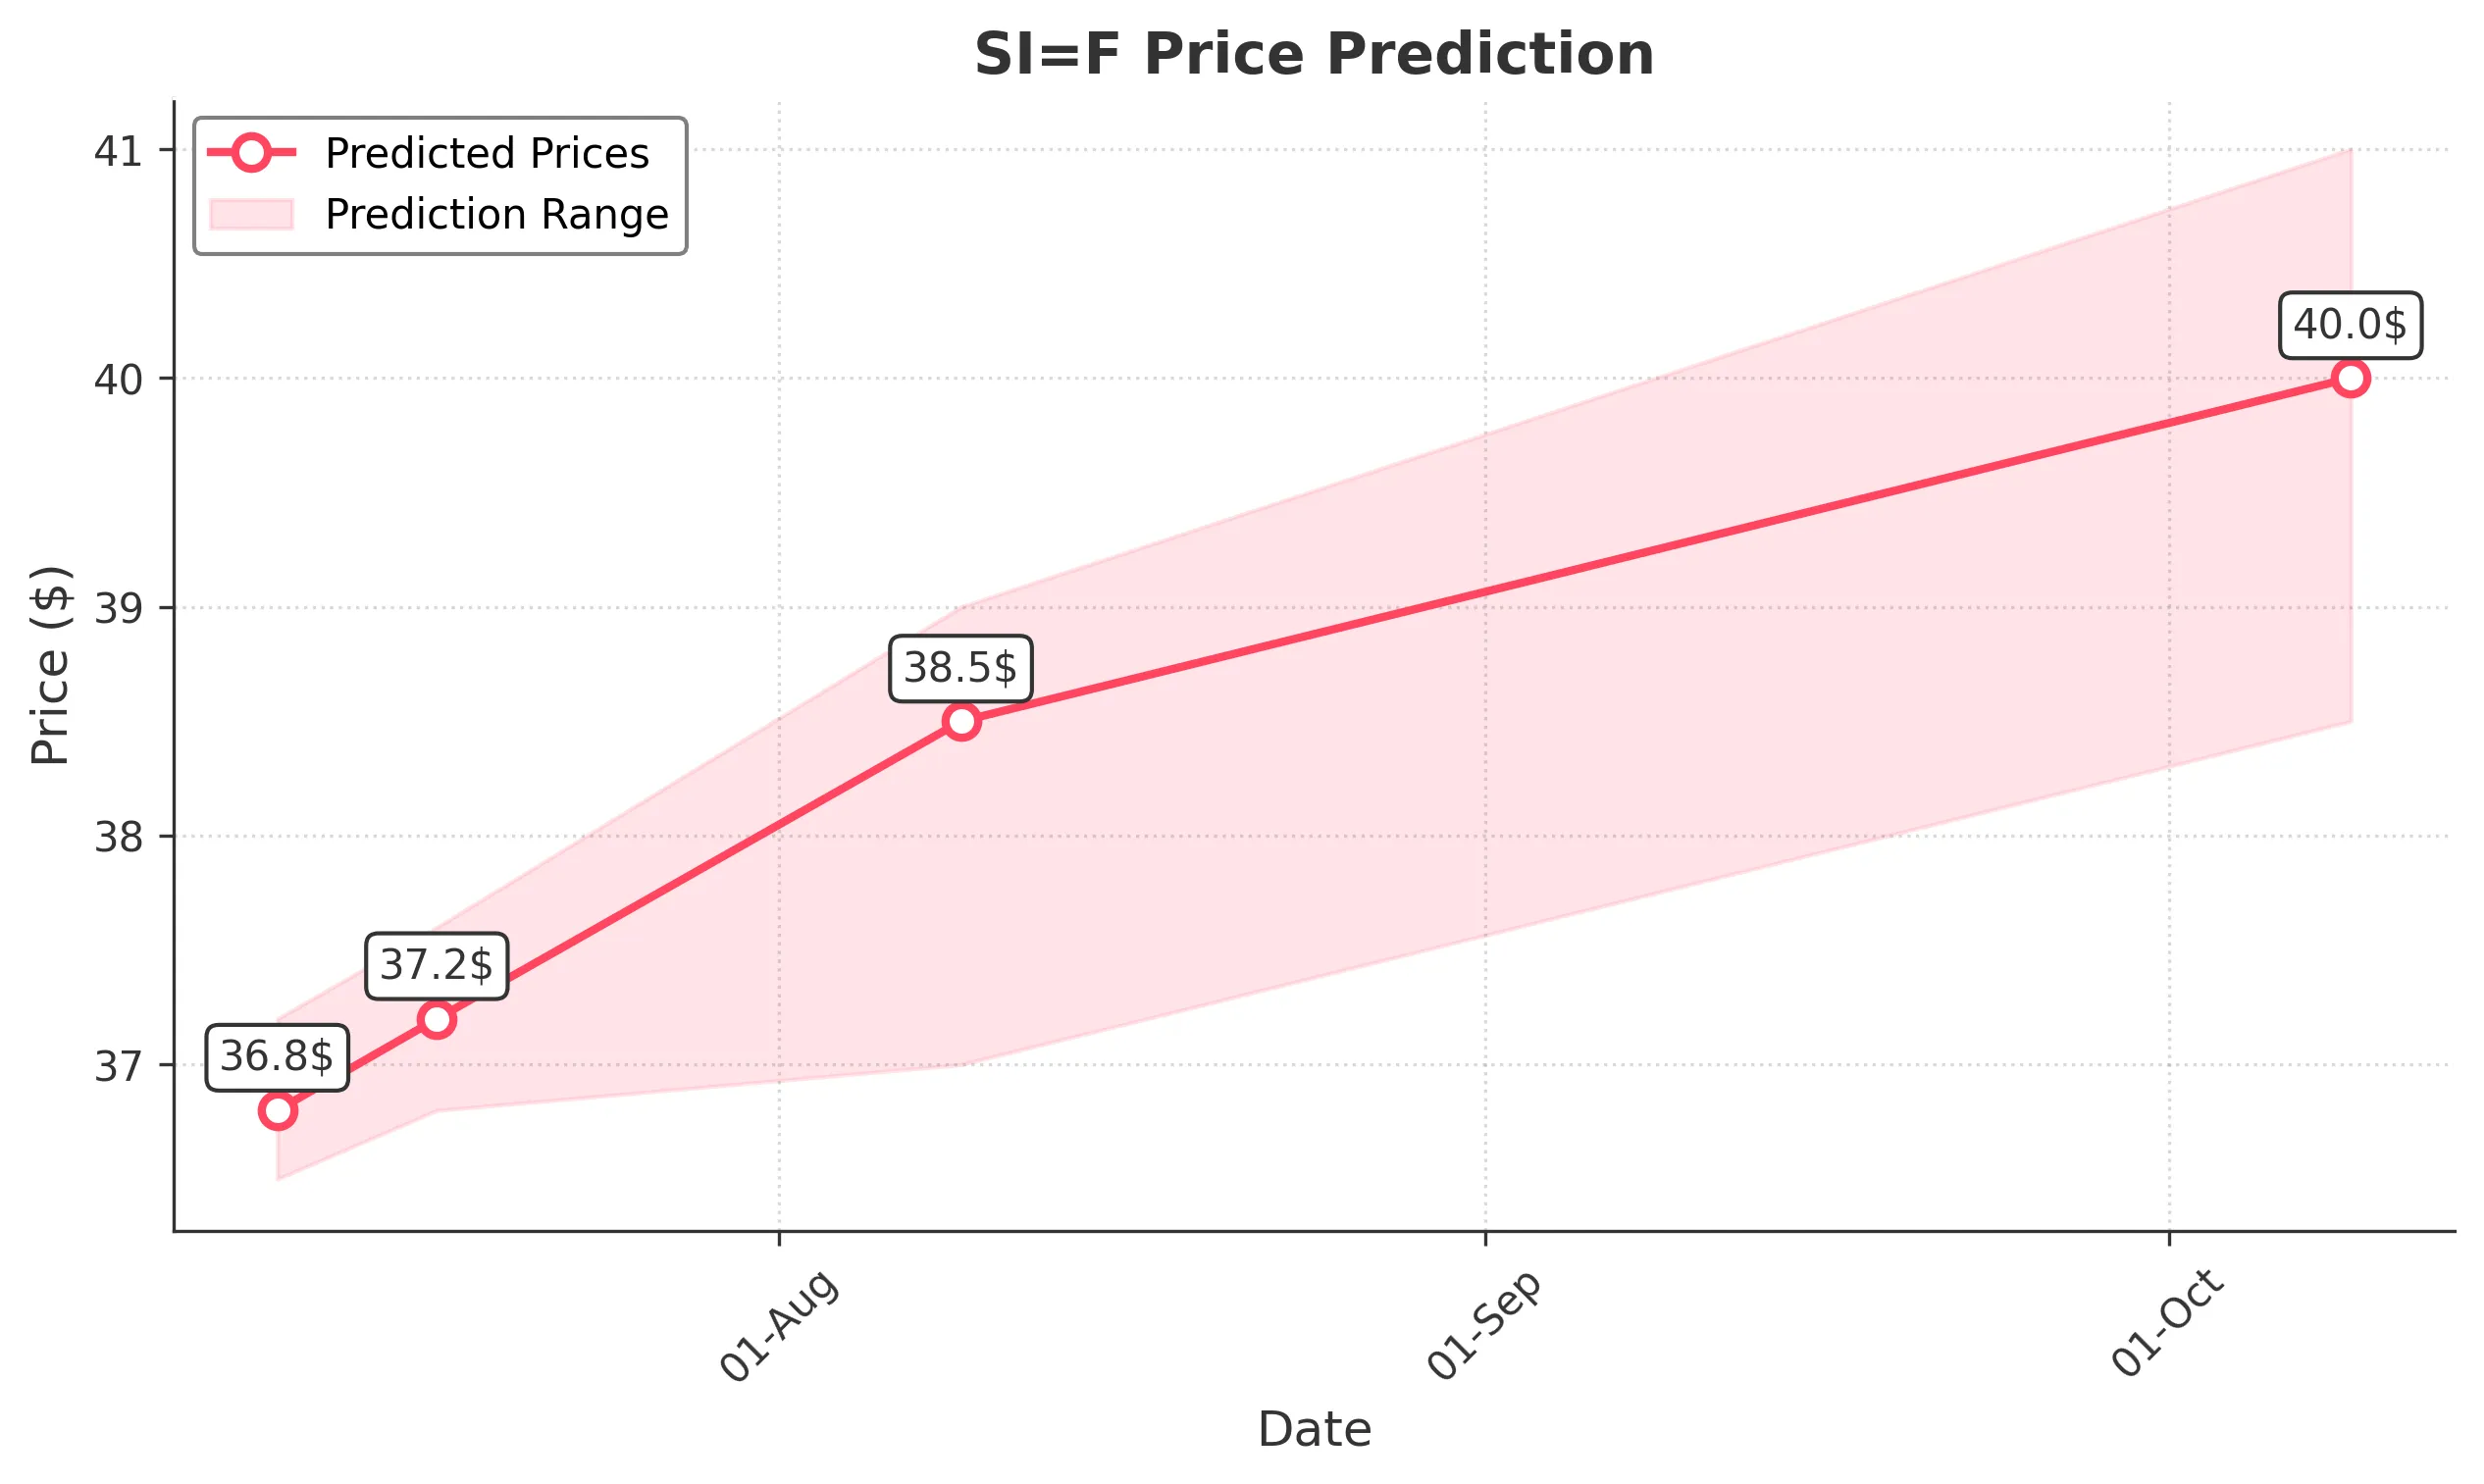
Target: July 10, 2025$36.8
$36.7
$37.2
$36.5
Description
The stock shows a bullish trend with a recent upward movement. The RSI is approaching overbought levels, indicating potential for a pullback. However, the MACD is positive, suggesting continued momentum. Volume has been stable, supporting the price action.
Analysis
Over the past 3 months, SI=F has shown a bullish trend, with significant support at 36.00 and resistance around 37.00. The MACD indicates upward momentum, while the RSI suggests caution as it nears overbought territory. Volume patterns are stable, but recent spikes indicate increased interest.
Confidence Level
Potential Risks
Potential market volatility and profit-taking could lead to a price correction.
1 Week Prediction
Target: July 17, 2025$37.2
$36.9
$37.6
$36.8
Description
The stock is expected to continue its upward trajectory, supported by strong bullish momentum. The recent candlestick patterns indicate buying pressure. However, the RSI is nearing overbought levels, which may lead to a short-term pullback.
Analysis
The stock has maintained a bullish trend with key support at 36.00 and resistance at 37.50. The MACD remains positive, and the RSI is approaching overbought levels. Volume has been consistent, indicating strong interest, but caution is advised as profit-taking may occur.
Confidence Level
Potential Risks
Market sentiment could shift due to external economic factors, impacting the stock's performance.
1 Month Prediction
Target: August 9, 2025$38.5
$37.8
$39
$37
Description
The stock is projected to rise further as bullish sentiment persists. The MACD indicates strong momentum, and the recent price action supports a continuation of the uptrend. However, the RSI suggests caution as it approaches overbought territory.
Analysis
SI=F has shown a strong bullish trend with significant resistance at 39.00. The MACD is bullish, and the RSI is nearing overbought levels, indicating potential for a pullback. Volume patterns suggest sustained interest, but external factors could impact future performance.
Confidence Level
Potential Risks
Economic data releases and geopolitical events could introduce volatility, affecting the stock's trajectory.
3 Months Prediction
Target: October 9, 2025$40
$39
$41
$38.5
Description
The stock is expected to reach new highs as bullish momentum continues. The technical indicators support this outlook, but the RSI indicates potential overbought conditions. Market sentiment remains positive, but caution is warranted.
Analysis
Over the past three months, SI=F has demonstrated a strong upward trend with key support at 36.00 and resistance at 41.00. The MACD remains bullish, but the RSI suggests caution as it approaches overbought levels. Volume patterns indicate strong interest, but external factors could introduce volatility.
Confidence Level
Potential Risks
Long-term predictions are subject to market volatility and unforeseen economic events that could alter the trend.