SIF Trading Predictions
1 Day Prediction
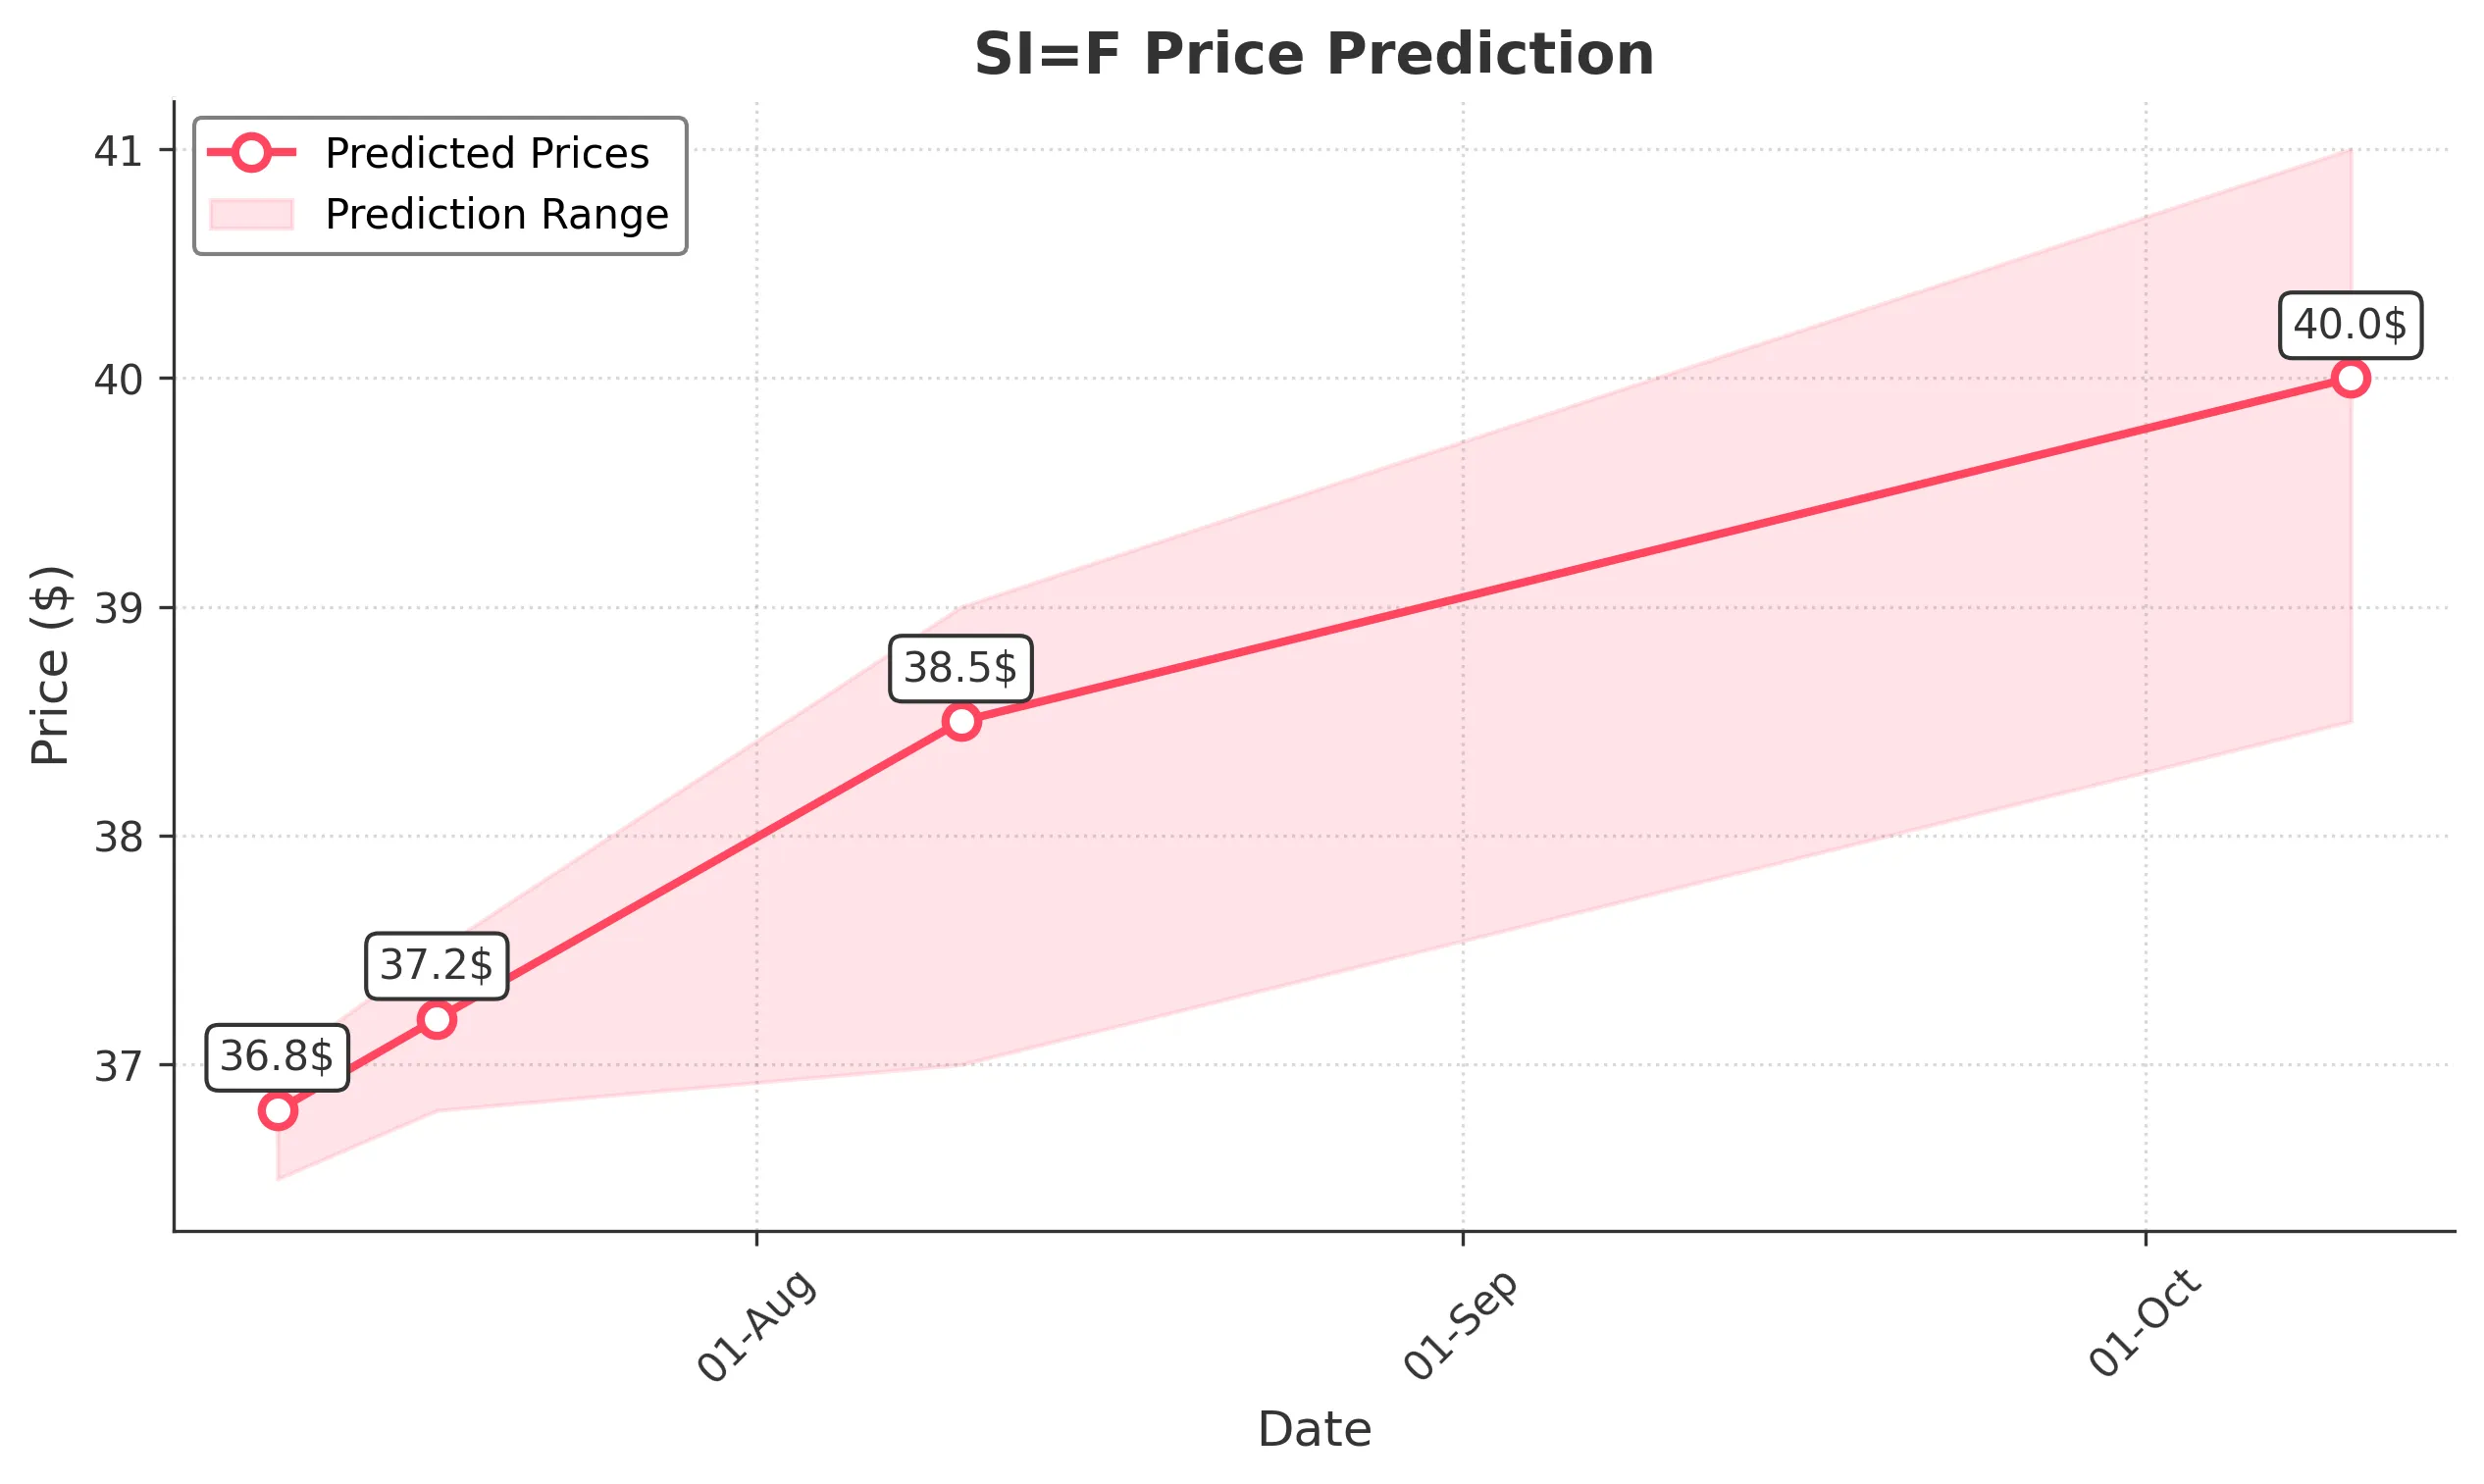
Target: July 11, 2025$36.8
$36.7
$37
$36.5
Description
The stock shows a bullish trend with a recent upward movement. The RSI is approaching overbought levels, indicating potential for a pullback. However, the MACD is positive, suggesting continued momentum. Expect slight volatility due to market sentiment.
Analysis
Over the past 3 months, SI=F has shown a bullish trend, with significant support at 36.00 and resistance around 37.00. The MACD indicates upward momentum, while the RSI suggests caution as it nears overbought territory. Volume has been stable, with occasional spikes.
Confidence Level
Potential Risks
Potential market corrections or external news could impact the price.
1 Week Prediction
Target: July 18, 2025$37.2
$36.9
$37.5
$36.8
Description
The stock is expected to continue its upward trajectory, supported by strong buying interest. The Bollinger Bands indicate potential for a breakout. However, the RSI is high, suggesting a possible pullback in the near term.
Analysis
The stock has maintained a bullish trend, with key support at 36.00. The recent price action shows a strong upward movement, but the RSI indicates overbought conditions. Volume patterns suggest healthy trading activity, but external factors could introduce volatility.
Confidence Level
Potential Risks
Market volatility and profit-taking could lead to fluctuations.
1 Month Prediction
Target: August 10, 2025$38.5
$37.8
$39
$37
Description
The stock is likely to reach new highs as bullish sentiment persists. The Fibonacci retracement levels suggest a target around 38.50. However, the RSI indicates potential overbought conditions, which could lead to corrections.
Analysis
SI=F has shown a strong bullish trend, with resistance at 39.00. The MACD remains positive, indicating momentum. However, the RSI is approaching overbought levels, suggesting caution. Volume has been consistent, but external factors may introduce uncertainty.
Confidence Level
Potential Risks
Economic data releases or geopolitical events could impact market sentiment.
3 Months Prediction
Target: October 10, 2025$40
$39
$41
$38.5
Description
Long-term bullish outlook as the stock is expected to break through resistance levels. The overall market sentiment is positive, but potential economic downturns could pose risks. Watch for volume spikes indicating strong buying interest.
Analysis
The stock has been on a bullish trend, with significant resistance at 41.00. The MACD and moving averages support upward momentum, but the RSI indicates potential overbought conditions. Volume patterns suggest healthy trading, but external economic factors could introduce risks.
Confidence Level
Potential Risks
Market corrections and economic indicators could lead to unexpected volatility.