SIF Trading Predictions
1 Day Prediction
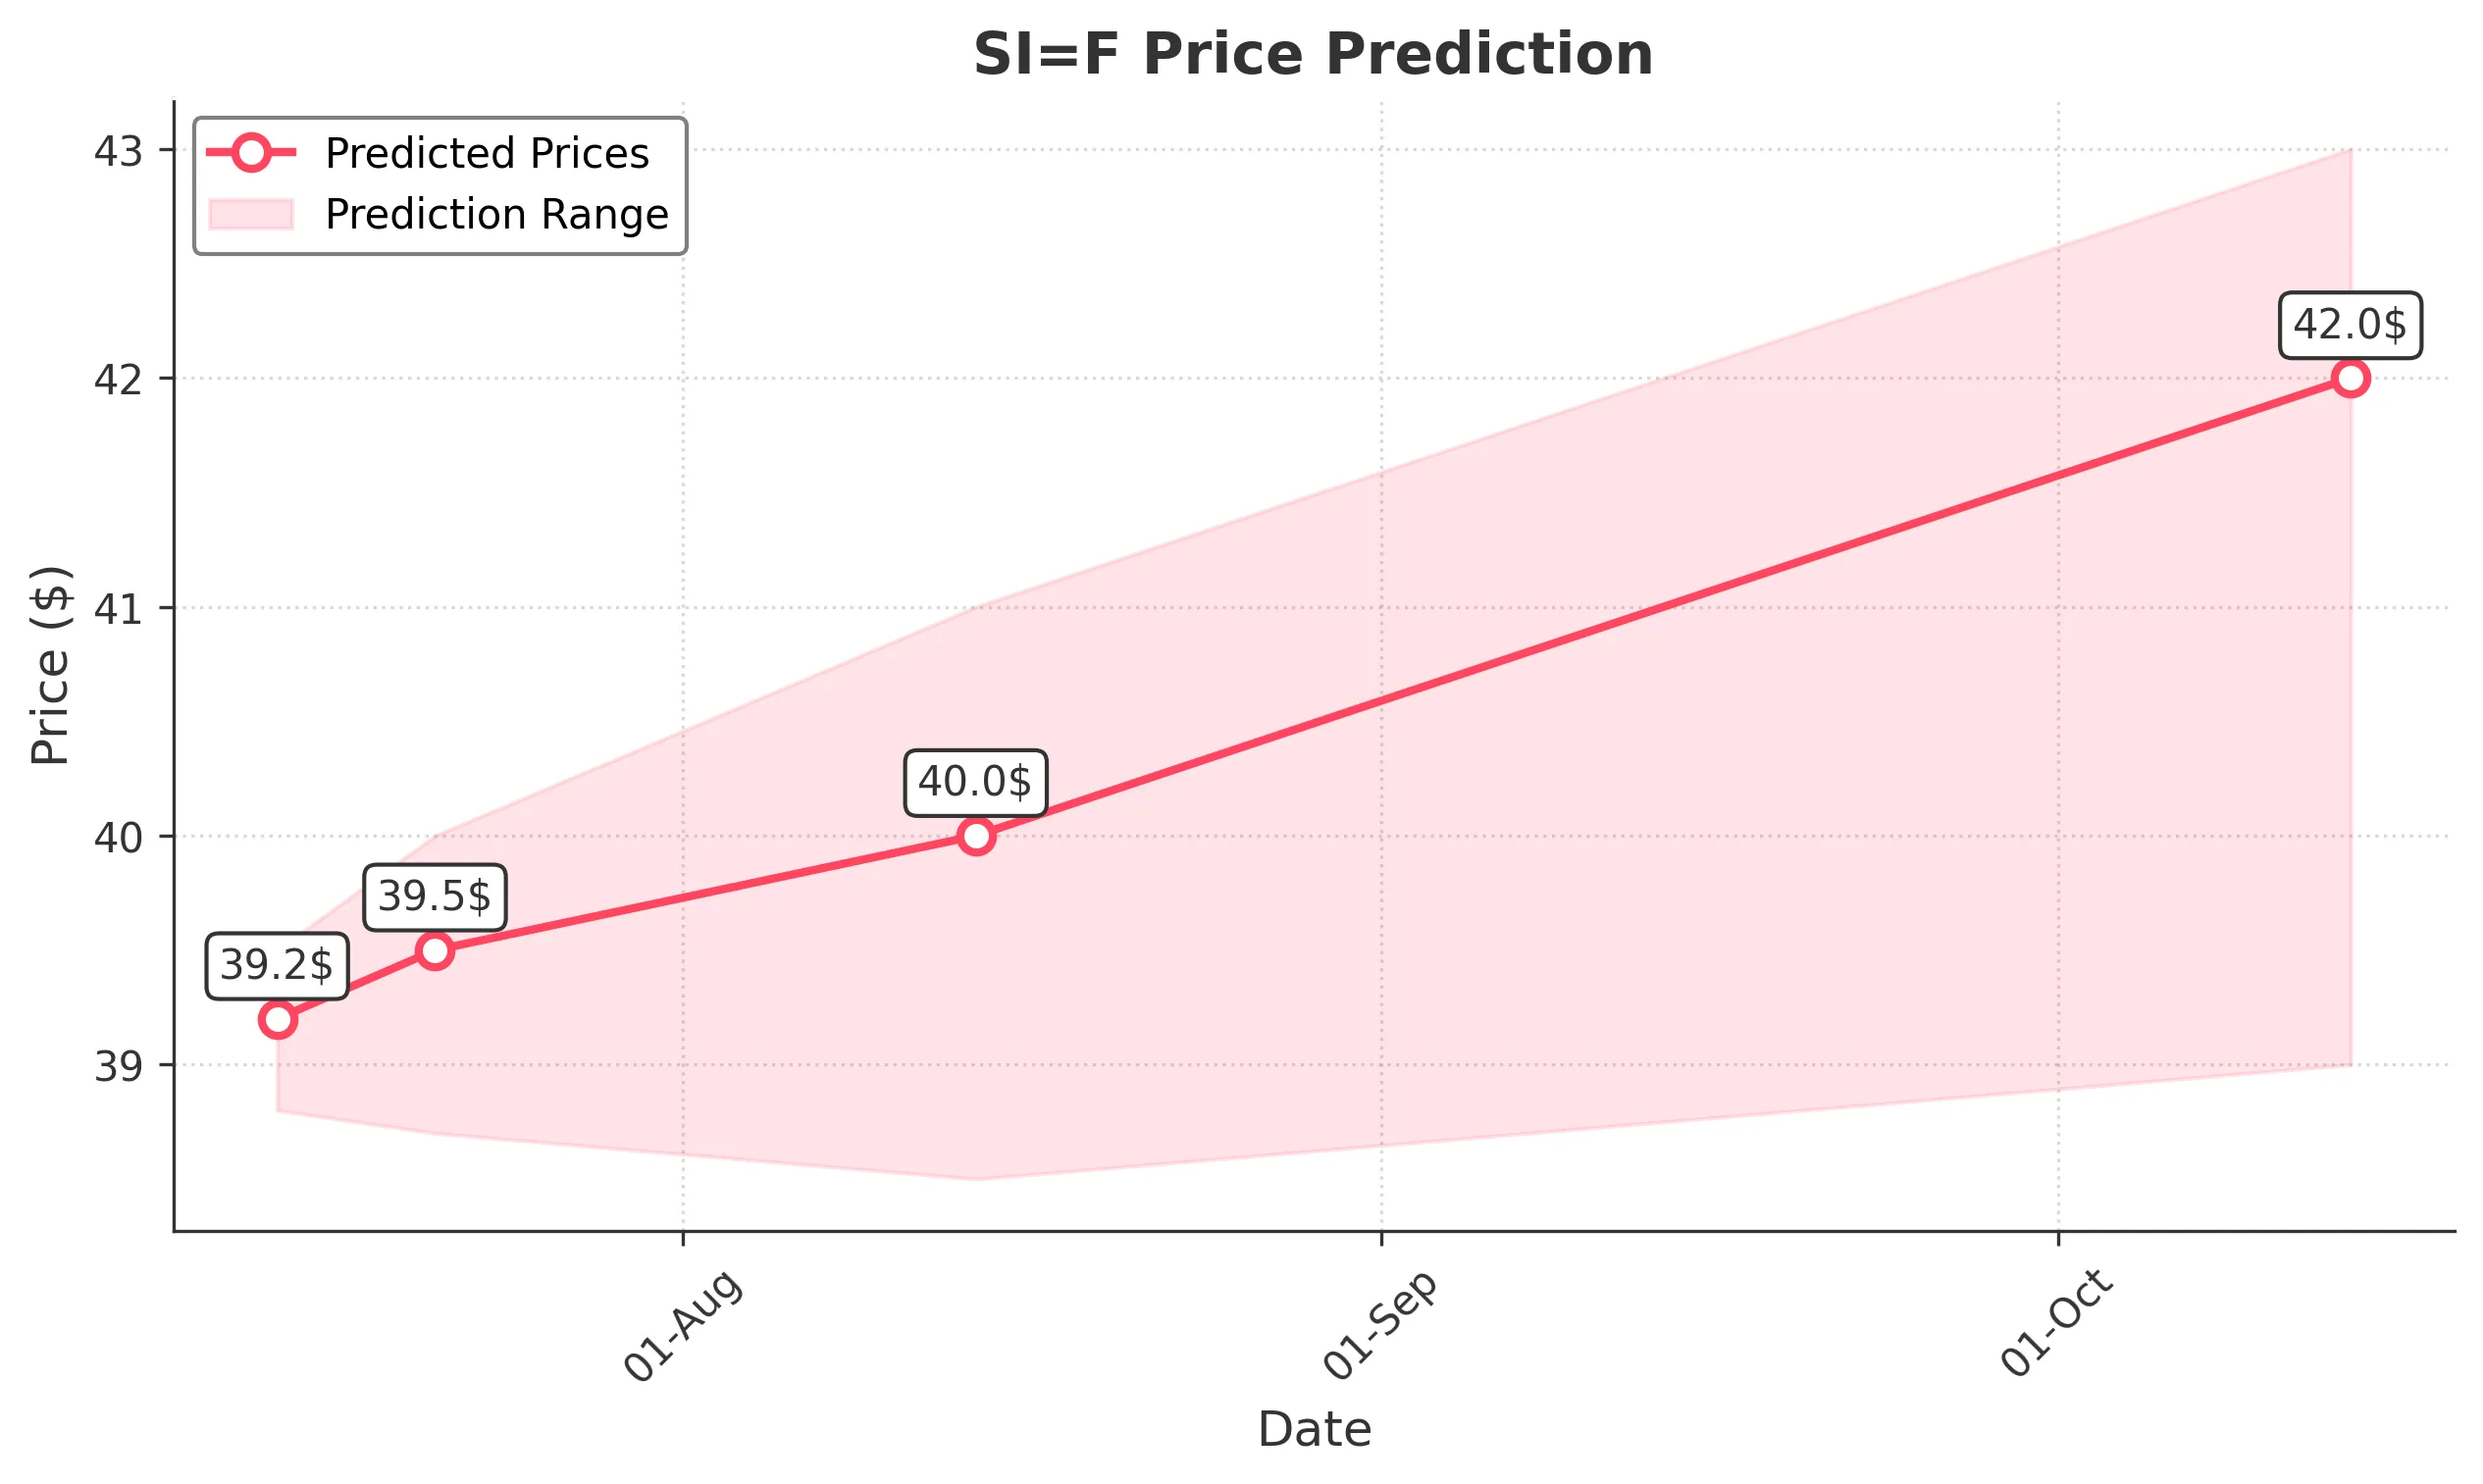
Target: July 14, 2025$39.2
$39
$39.5
$38.8
Description
The stock shows bullish momentum with a recent close above 38.95. The RSI is nearing overbought levels, indicating potential for a pullback. However, strong buying volume suggests continued upward pressure. Watch for potential resistance at 39.50.
Analysis
The stock has been in a bullish trend, recently breaking above key resistance levels. The MACD is positive, and the volume has been increasing, indicating strong buying interest. However, the RSI suggests caution as it approaches overbought territory.
Confidence Level
Potential Risks
Potential for a pullback due to overbought RSI conditions and market volatility.
1 Week Prediction
Target: July 21, 2025$39.5
$39.2
$40
$38.7
Description
The stock is expected to continue its upward trend, with strong support at 38.95. The bullish candlestick patterns and increasing volume support this outlook. However, resistance at 40.00 may limit gains.
Analysis
The stock has shown consistent upward movement, with key support at 38.95. The MACD remains bullish, and the ATR indicates moderate volatility. Volume patterns suggest strong interest, but external market factors could impact performance.
Confidence Level
Potential Risks
Resistance at 40.00 could trigger profit-taking, and market sentiment may shift.
1 Month Prediction
Target: August 14, 2025$40
$39.5
$41
$38.5
Description
The stock is projected to reach 40.00, driven by bullish sentiment and strong technical indicators. However, potential resistance at 41.00 may create headwinds. Monitor for any bearish reversal signals.
Analysis
The stock has maintained a bullish trend, with significant support at 38.95. The MACD and RSI indicate strong momentum, but the stock is approaching overbought conditions. Volume trends are positive, but external factors could introduce volatility.
Confidence Level
Potential Risks
Market volatility and potential profit-taking could hinder upward momentum.
3 Months Prediction
Target: October 14, 2025$42
$40.5
$43
$39
Description
Long-term bullish outlook with potential to reach 42.00. The stock's upward trend is supported by strong fundamentals and technical indicators. However, watch for market corrections and external economic factors.
Analysis
The stock has shown a strong bullish trend over the past months, with key support at 39.00. The MACD is bullish, and the RSI indicates potential overbought conditions. Volume patterns suggest strong interest, but macroeconomic factors could introduce risks.
Confidence Level
Potential Risks
Economic conditions and market sentiment could lead to unexpected volatility.