SIF Trading Predictions
1 Day Prediction
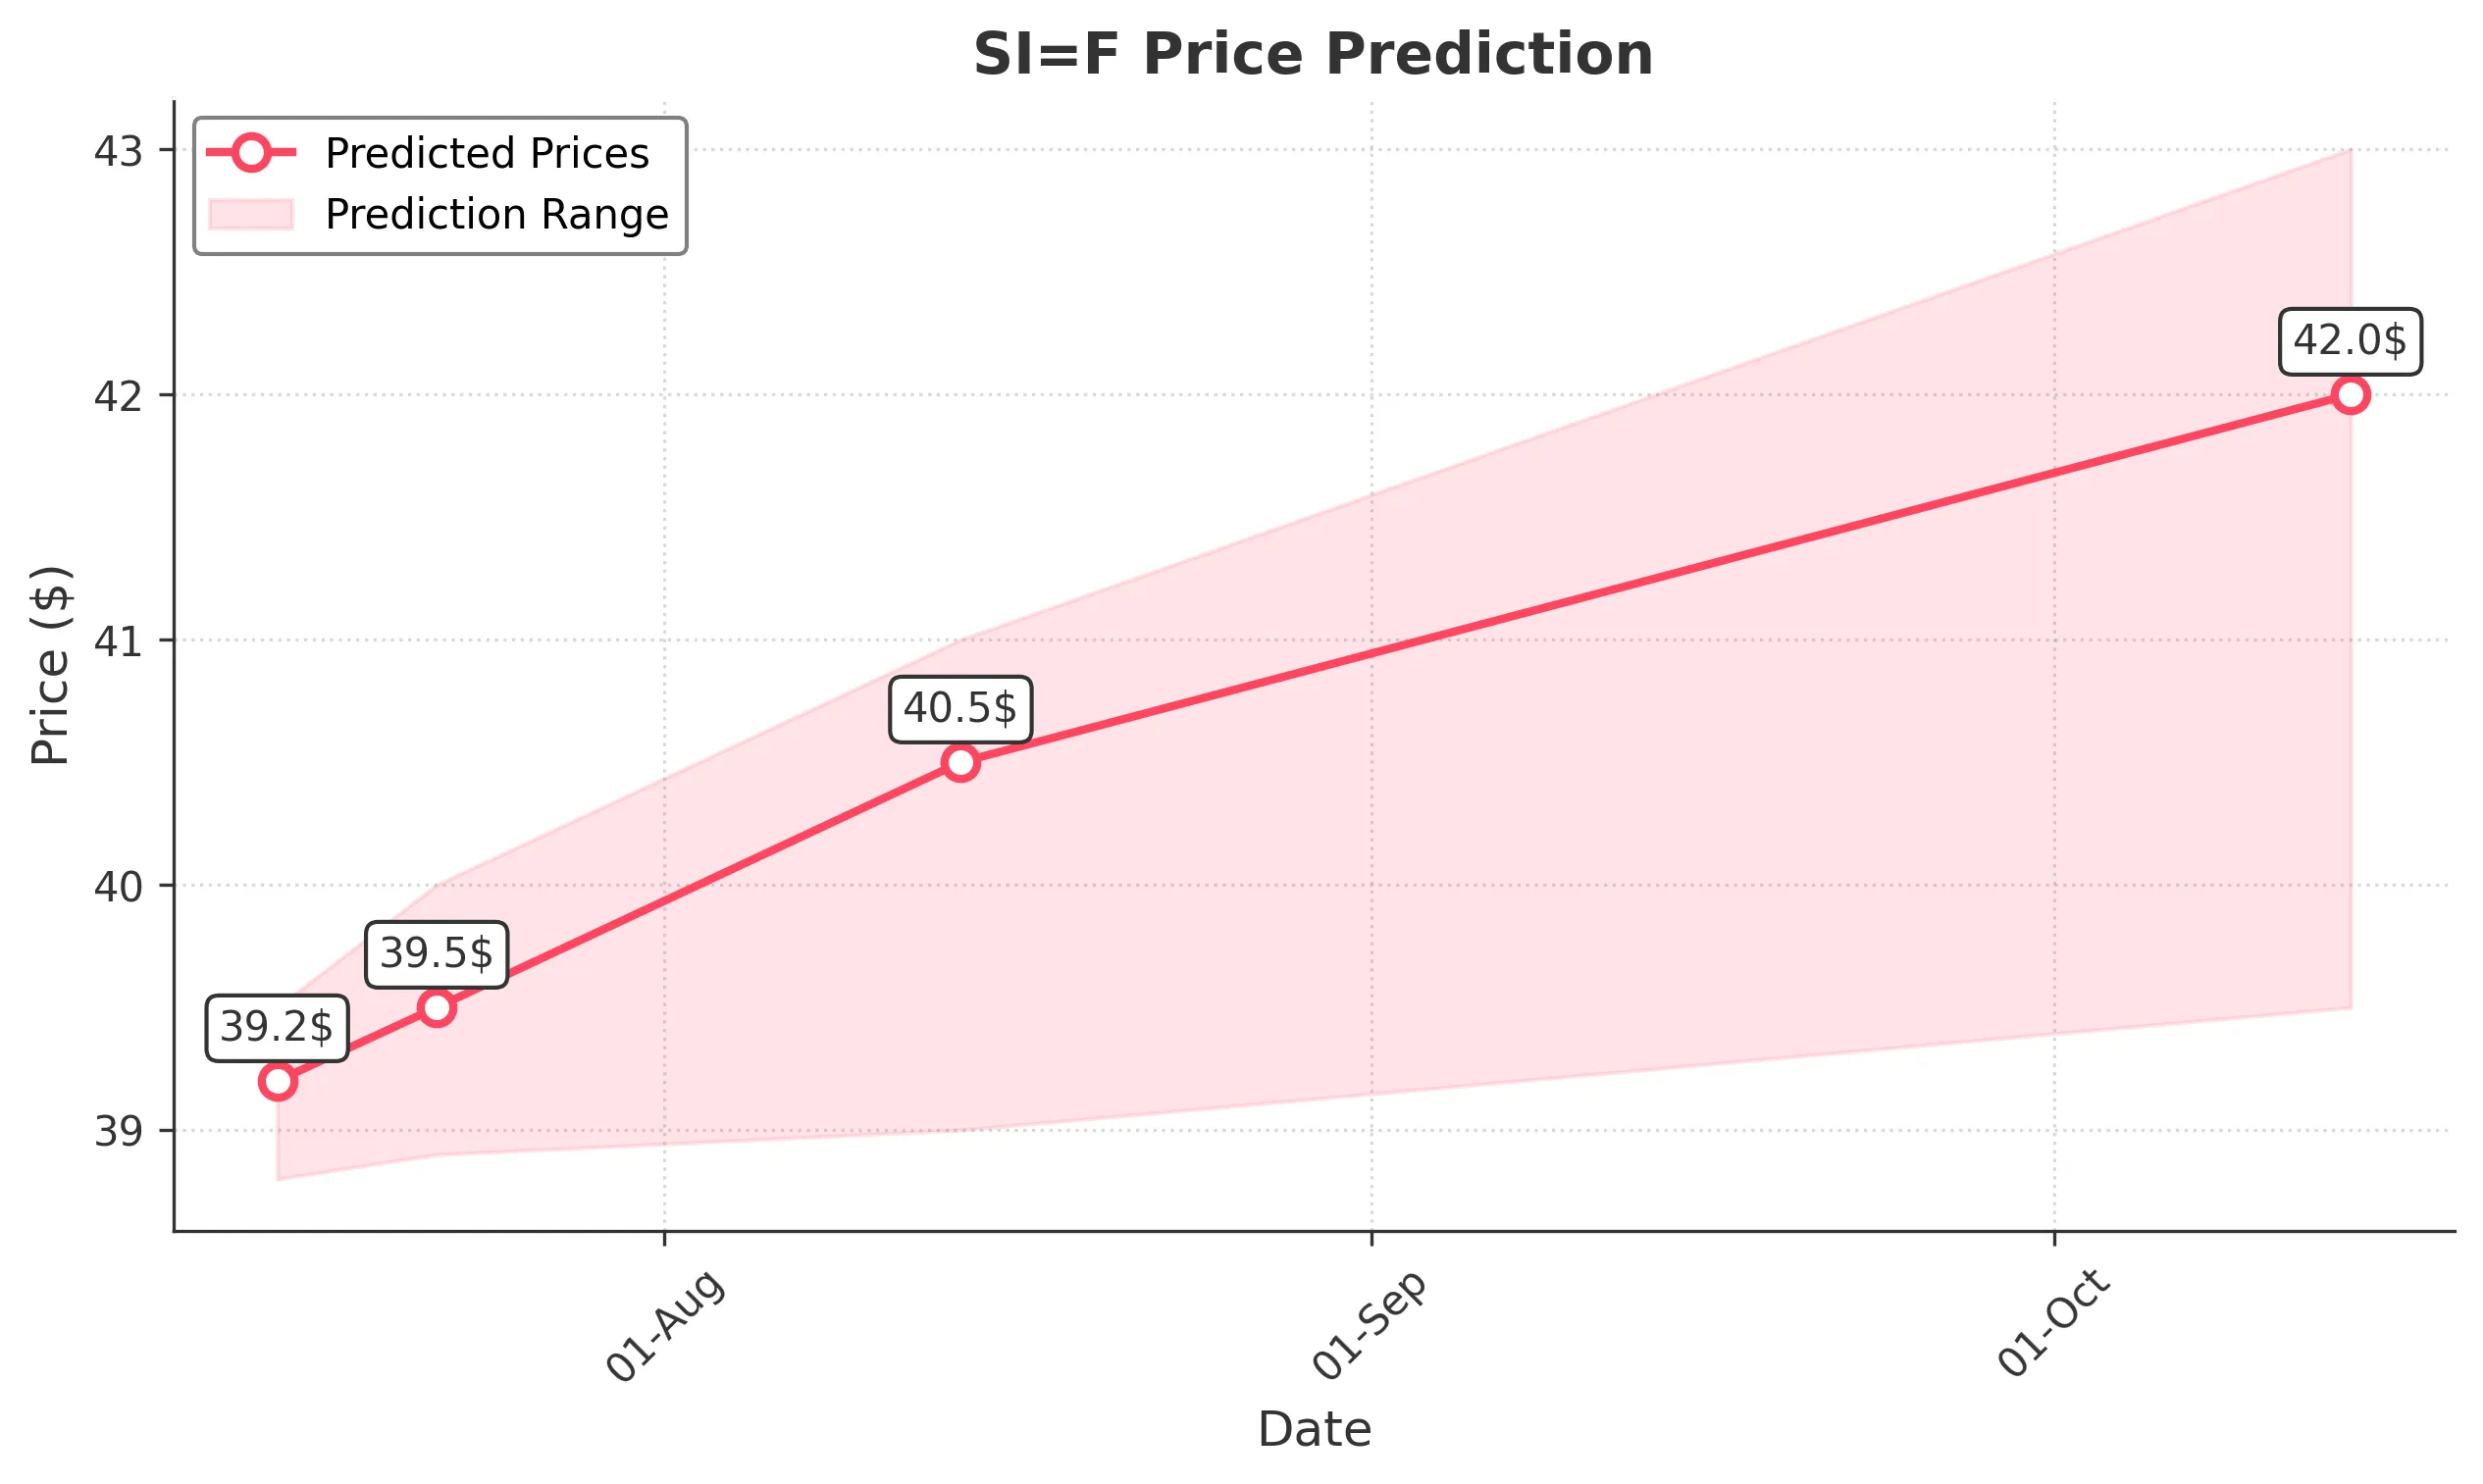
Target: July 15, 2025$39.2
$39
$39.5
$38.8
Description
The stock shows bullish momentum with a recent close at 38.955002. The MACD is positive, and RSI indicates strength. A potential breakout above 39.00 could lead to further gains, supported by volume spikes.
Analysis
The stock has been in a bullish trend, recently breaking resistance levels. The MACD and RSI indicate upward momentum, while volume spikes suggest strong buying interest. Key support is at 38.00, and resistance is at 39.50.
Confidence Level
Potential Risks
Market volatility and external news could impact the bullish trend.
1 Week Prediction
Target: July 22, 2025$39.5
$39.2
$40
$38.9
Description
The stock is expected to continue its upward trajectory, with strong bullish signals from technical indicators. A breakout above 39.50 could lead to a test of 40.00, supported by increasing volume.
Analysis
The stock has shown consistent upward movement, with key resistance at 40.00. The RSI is nearing overbought territory, indicating a possible pullback. However, strong buying volume suggests continued interest.
Confidence Level
Potential Risks
Potential market corrections or negative news could reverse the trend.
1 Month Prediction
Target: August 14, 2025$40.5
$39.8
$41
$39
Description
The stock is likely to reach 40.50 as bullish sentiment persists. The MACD remains positive, and the stock is above its moving averages. However, caution is advised as it approaches overbought levels.
Analysis
The stock has been in a strong uptrend, with significant support at 39.00. The Bollinger Bands indicate potential volatility, and the RSI suggests caution as it approaches overbought conditions.
Confidence Level
Potential Risks
Market sentiment shifts or economic data releases could impact the forecast.
3 Months Prediction
Target: October 14, 2025$42
$40
$43
$39.5
Description
Long-term bullish outlook with potential to reach 42.00. The stock's fundamentals and technical indicators support growth, but external economic factors could introduce volatility.
Analysis
The stock has shown resilience and upward momentum. Key support is at 39.50, while resistance is at 43.00. The market's overall sentiment and macroeconomic conditions will play a crucial role in future performance.
Confidence Level
Potential Risks
Economic downturns or unexpected news could lead to significant price corrections.