SIF Trading Predictions
1 Day Prediction
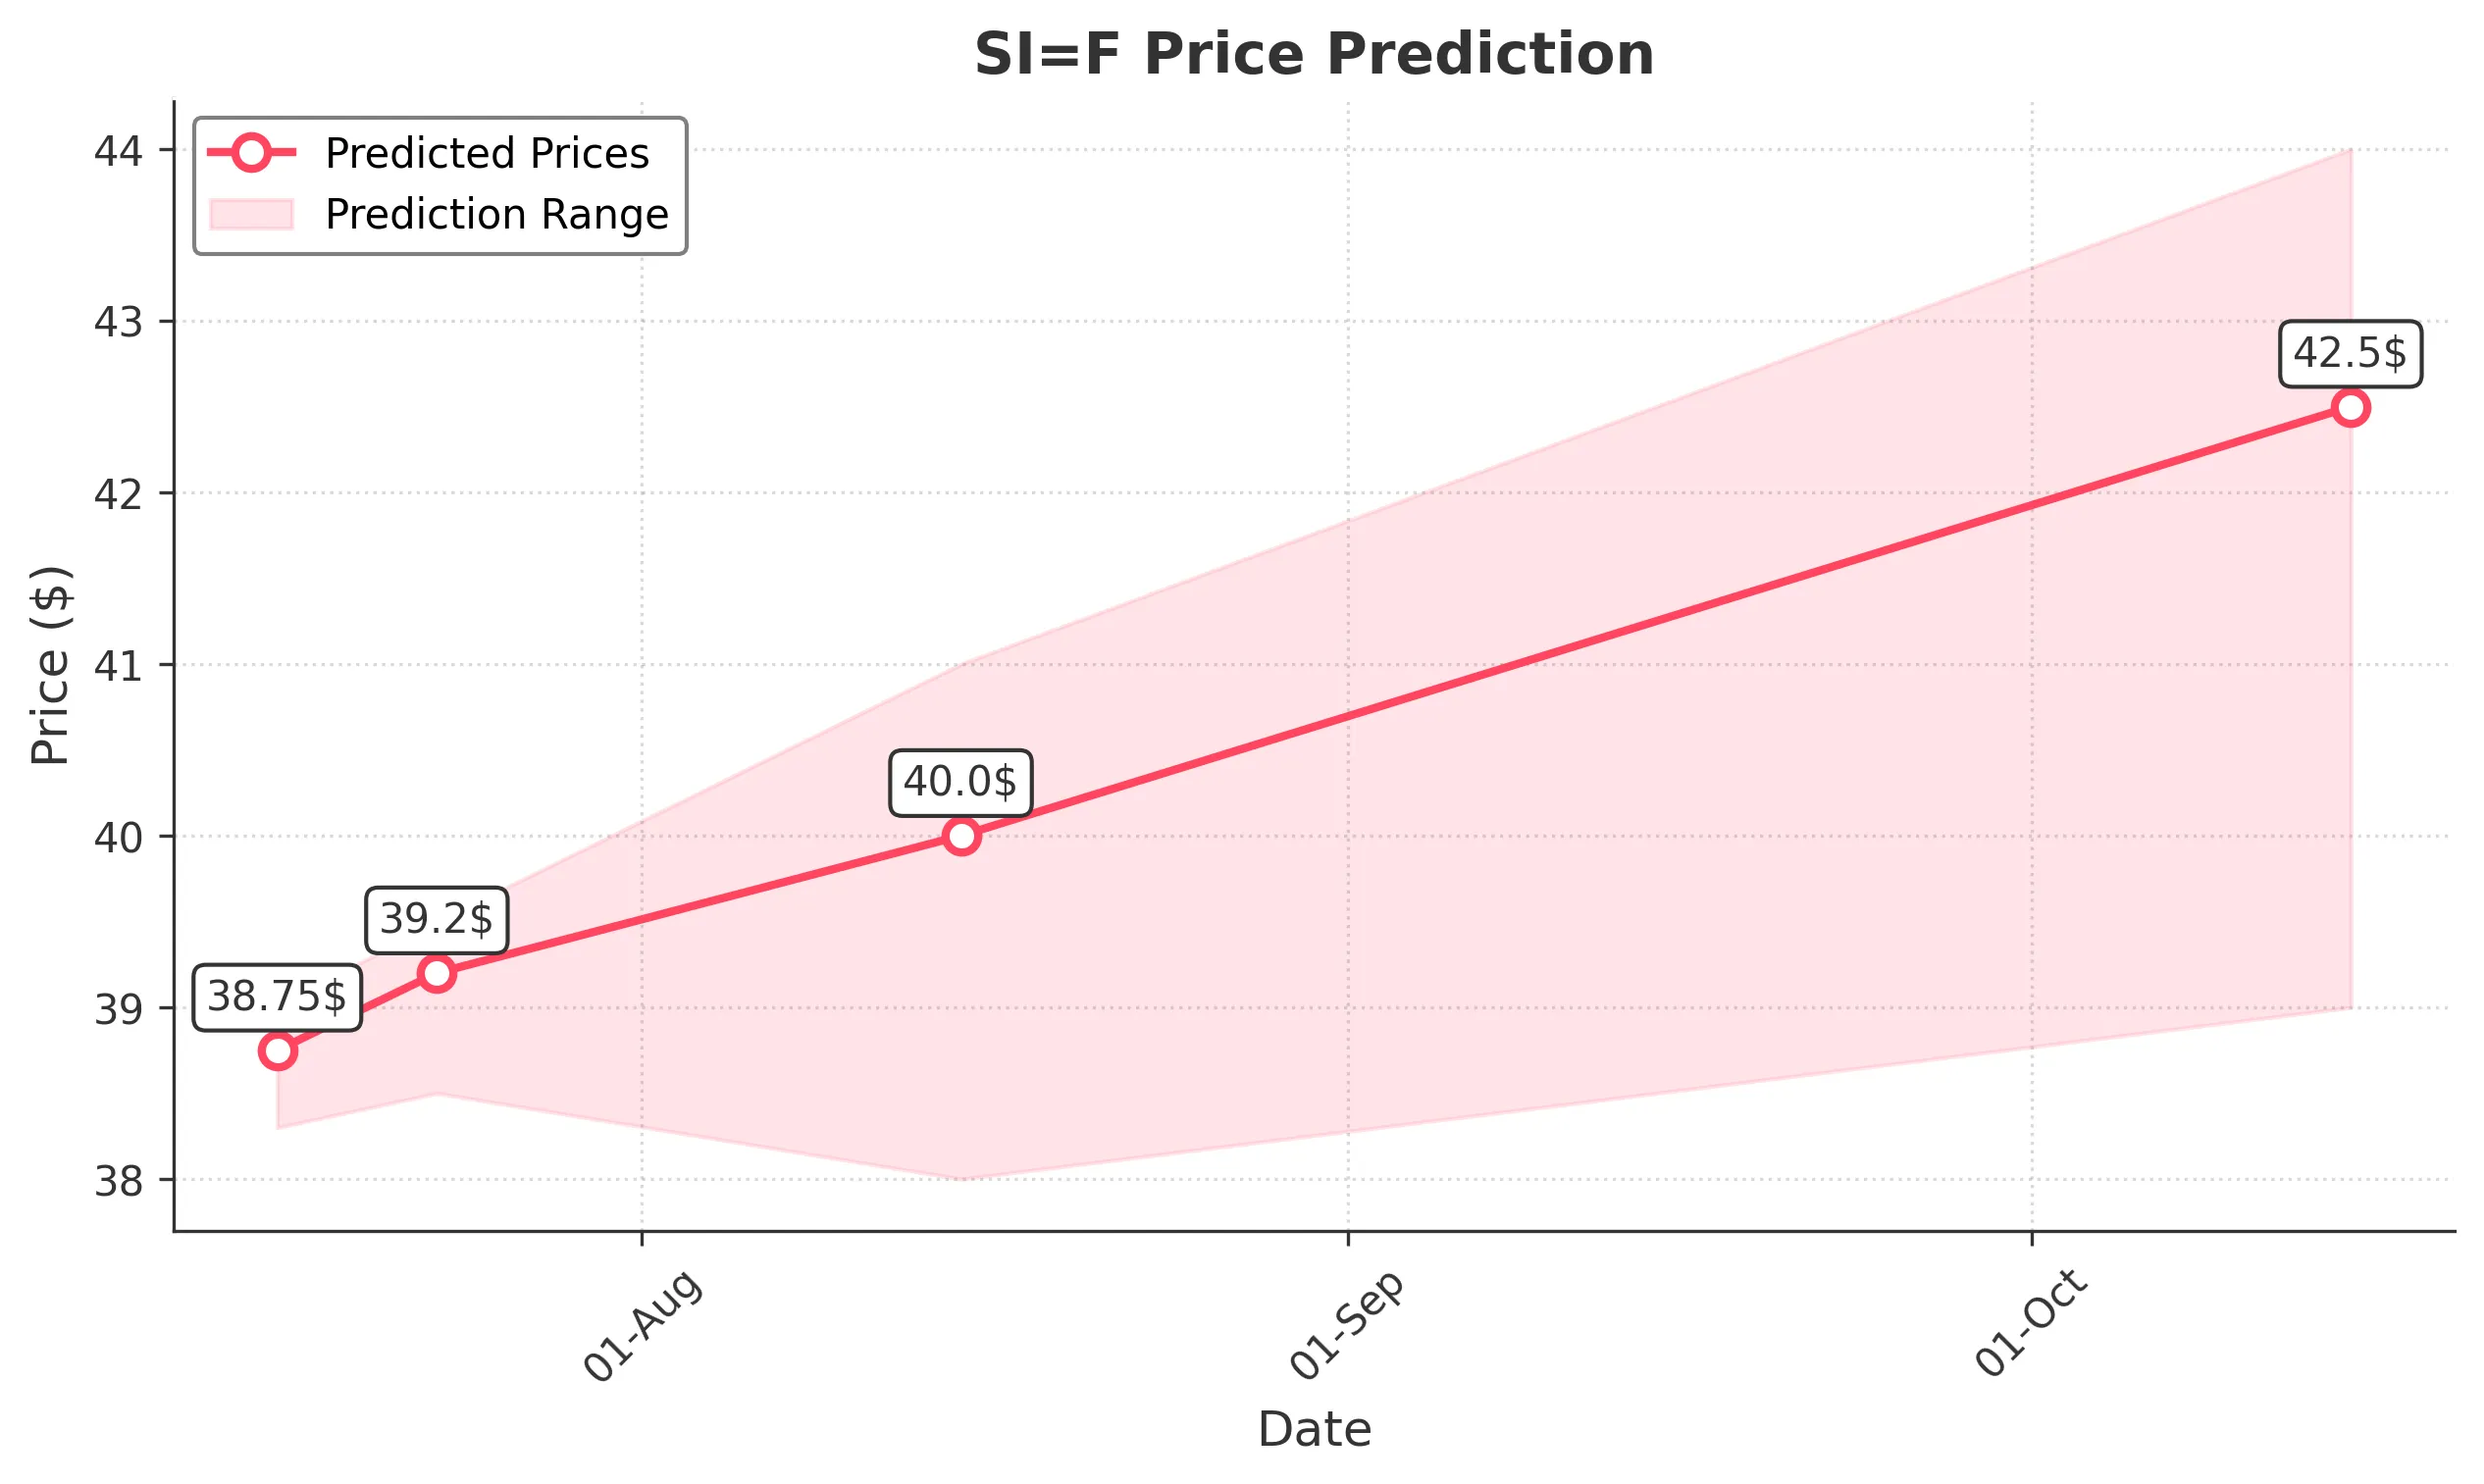
Target: July 16, 2025$38.75
$38.6
$39
$38.3
Description
The stock shows bullish momentum with a recent upward trend. The MACD is positive, and RSI indicates strength. A potential Doji pattern suggests indecision, but overall sentiment remains bullish.
Analysis
Over the past 3 months, SI=F has shown a bullish trend, with significant support at 36.00 and resistance around 39.00. The recent price action indicates strong buying interest, but caution is warranted due to potential market corrections.
Confidence Level
Potential Risks
Market volatility and external news could impact the price unexpectedly.
1 Week Prediction
Target: July 23, 2025$39.2
$38.8
$39.5
$38.5
Description
The stock is expected to continue its upward trajectory, supported by strong volume and bullish indicators. However, a potential resistance level at 39.50 may limit gains.
Analysis
The stock has been in a bullish phase, with key support at 36.00 and resistance at 39.50. The RSI is nearing overbought territory, indicating a possible pullback. Volume trends suggest strong interest, but caution is advised.
Confidence Level
Potential Risks
Any negative macroeconomic news could reverse the trend.
1 Month Prediction
Target: August 15, 2025$40
$39.5
$41
$38
Description
The stock is likely to reach new highs as bullish sentiment persists. The Fibonacci retracement levels support upward movement, but overbought conditions may lead to volatility.
Analysis
SI=F has shown a strong upward trend, with significant resistance at 41.00. The MACD and RSI indicate bullish momentum, but the stock is approaching overbought levels. Volume patterns suggest sustained interest, but external factors could introduce risk.
Confidence Level
Potential Risks
Market corrections or profit-taking could lead to price fluctuations.
3 Months Prediction
Target: October 15, 2025$42.5
$41
$44
$39
Description
Long-term bullish outlook supported by strong fundamentals and technical indicators. However, potential market corrections and economic factors could impact performance.
Analysis
The stock has maintained a bullish trend, with key support at 39.00 and resistance at 44.00. The overall market sentiment is positive, but caution is warranted due to potential volatility and external economic influences.
Confidence Level
Potential Risks
Unforeseen economic events or changes in market sentiment could lead to significant price adjustments.