SIF Trading Predictions
1 Day Prediction
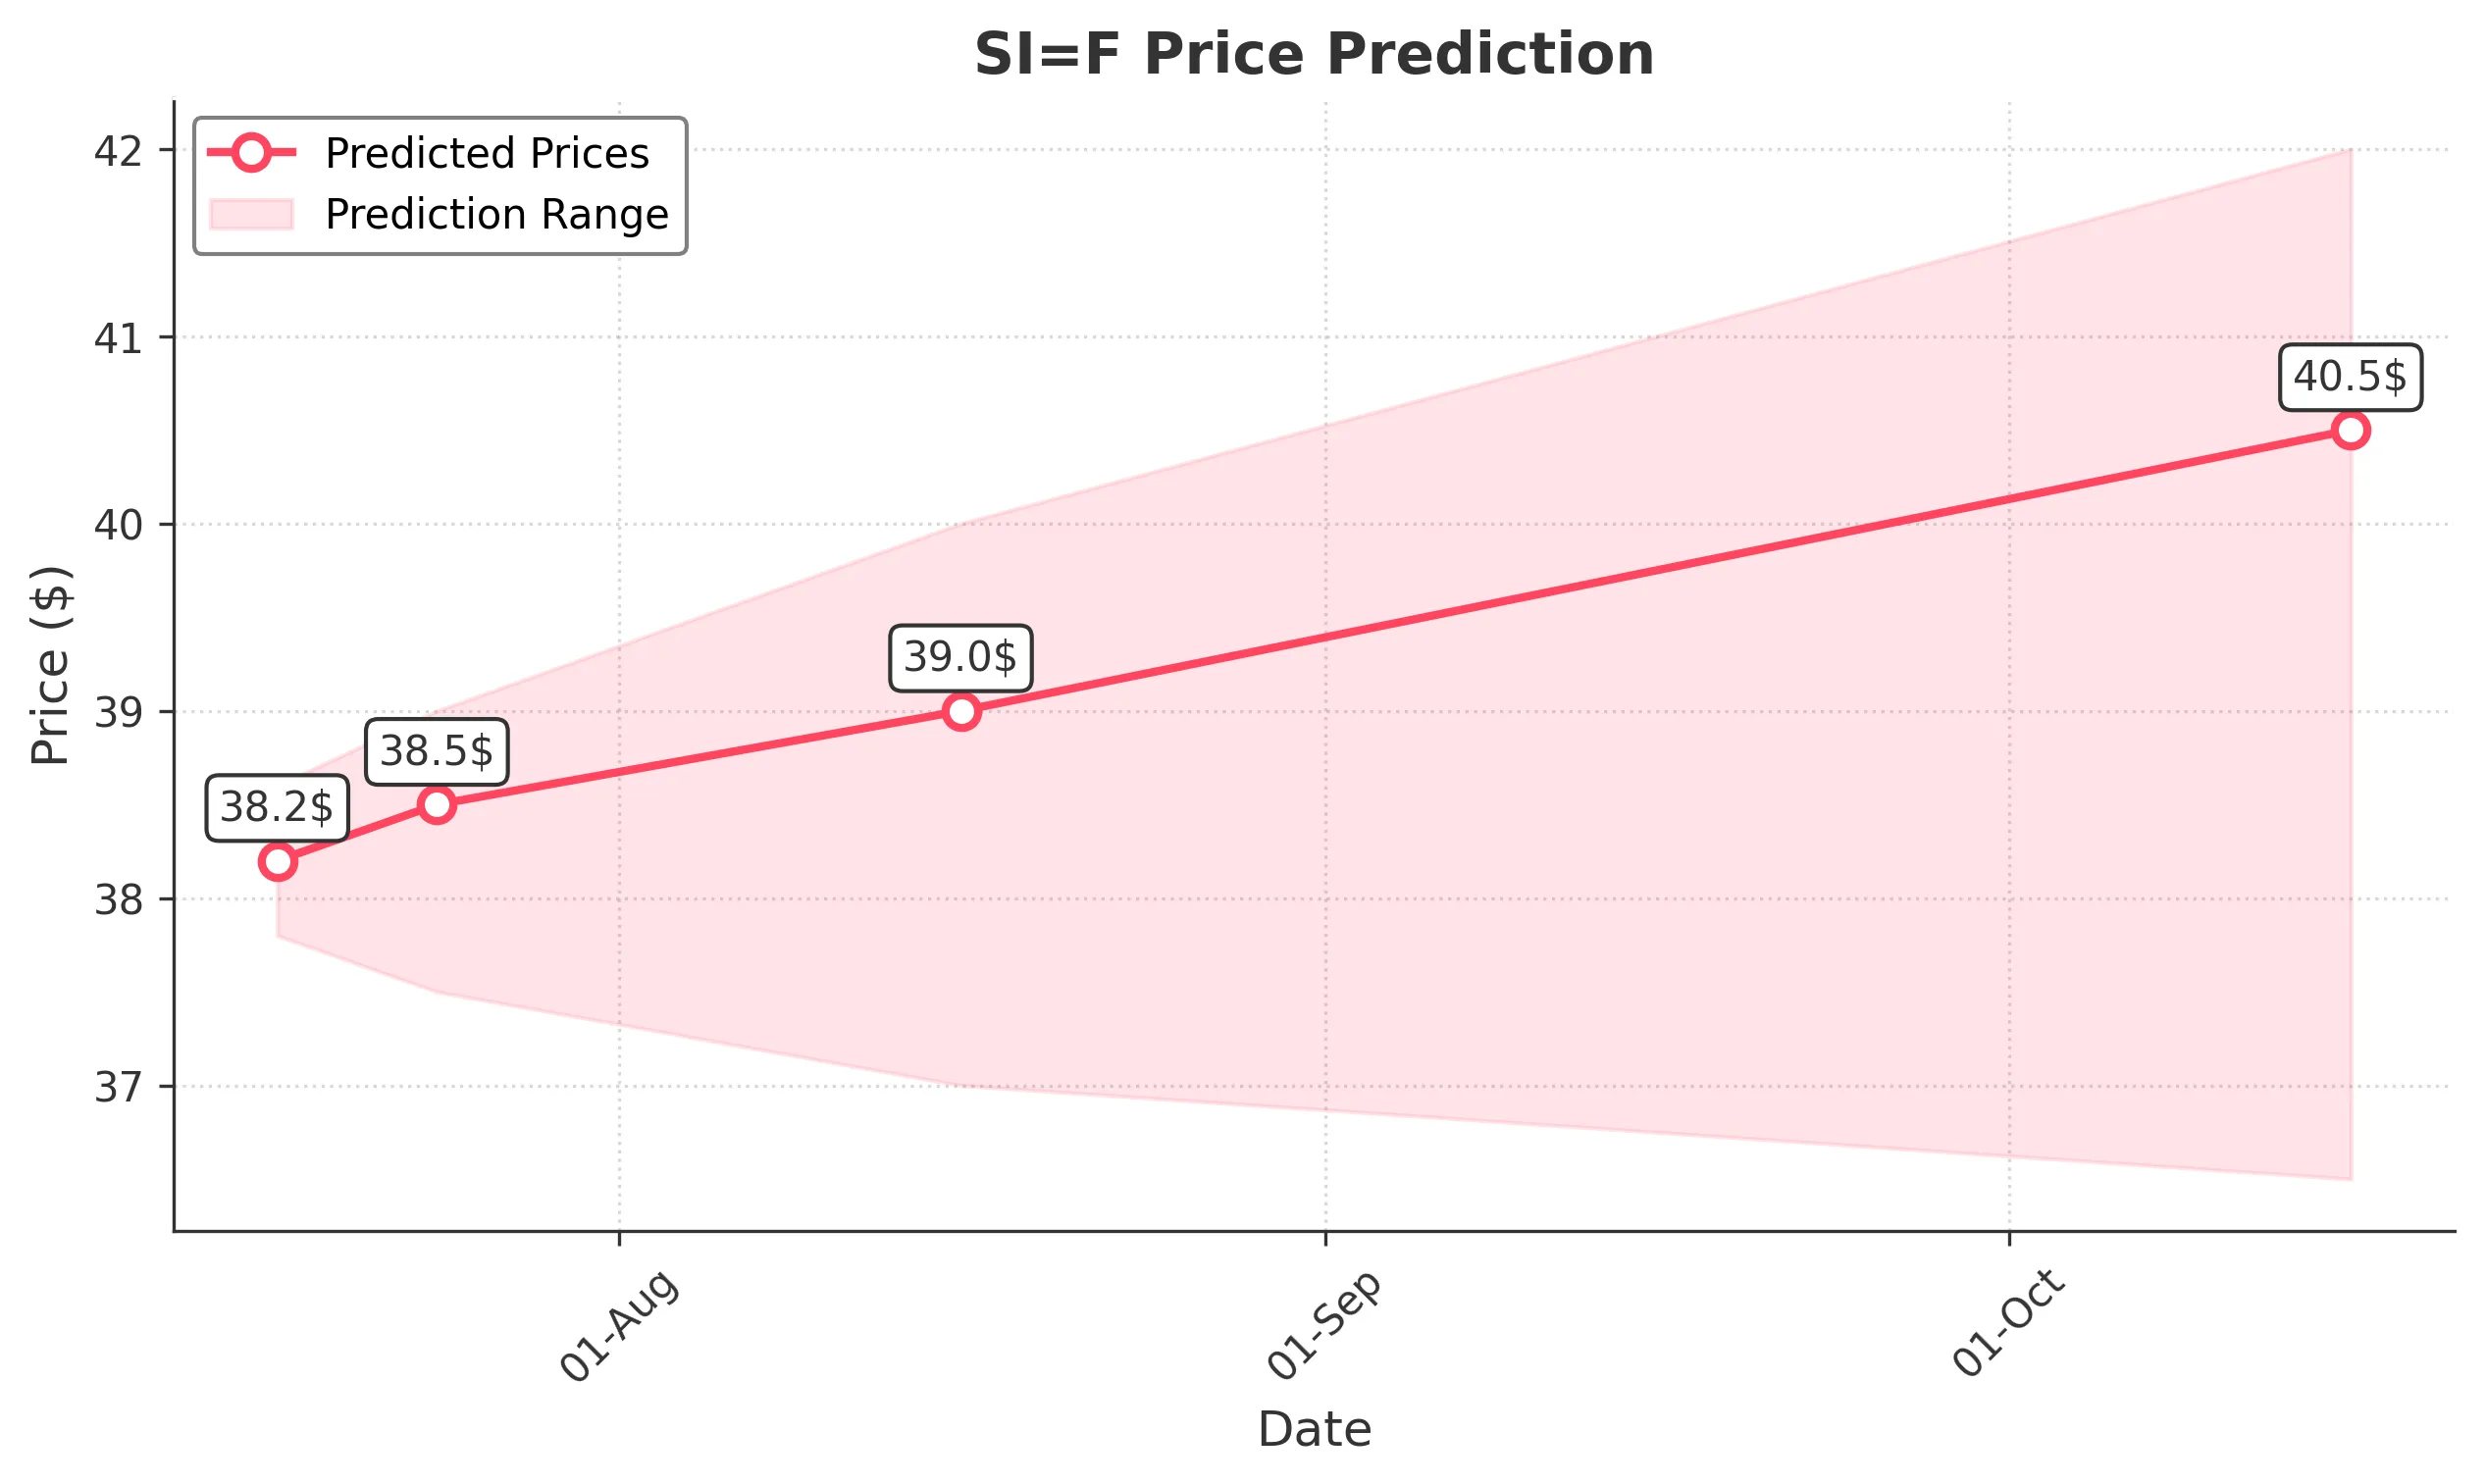
Target: July 17, 2025$38.2
$38.1
$38.6
$37.8
Description
The stock shows bullish momentum with a recent upward trend. The RSI is nearing overbought levels, indicating potential for a pullback. However, the MACD is positive, suggesting continued strength. Expect slight fluctuations around the current price.
Analysis
Over the past 3 months, SI=F has shown a bullish trend, with significant support at $36.00 and resistance around $39.00. The recent price action indicates strong buying interest, but the RSI suggests caution as it approaches overbought territory.
Confidence Level
Potential Risks
Potential market volatility and profit-taking could lead to a price drop.
1 Week Prediction
Target: July 24, 2025$38.5
$38.2
$39
$37.5
Description
The stock is expected to maintain its upward trajectory, supported by strong volume and bullish candlestick patterns. However, the RSI indicates potential overbought conditions, which may lead to short-term corrections.
Analysis
The stock has been in a bullish phase, with key support at $36.00 and resistance at $39.00. The MACD remains positive, and volume trends suggest strong buying interest. However, caution is warranted as the RSI approaches overbought levels.
Confidence Level
Potential Risks
Market sentiment could shift due to external economic factors, impacting the stock's performance.
1 Month Prediction
Target: August 16, 2025$39
$38.5
$40
$37
Description
The stock is likely to continue its upward trend, driven by positive market sentiment and strong technical indicators. However, the potential for profit-taking and market corrections remains a risk.
Analysis
SI=F has shown a strong bullish trend with significant resistance at $39.00. The MACD and moving averages indicate continued strength, but the RSI suggests caution as it nears overbought territory. Volume patterns indicate sustained interest.
Confidence Level
Potential Risks
Economic data releases and geopolitical events could introduce volatility.
3 Months Prediction
Target: October 16, 2025$40.5
$39.5
$42
$36.5
Description
Long-term bullish sentiment is expected to drive prices higher, but potential market corrections could occur. The stock's fundamentals and technical indicators support this outlook, though external factors may introduce volatility.
Analysis
The stock has been on a bullish trend, with key support at $36.00 and resistance at $42.00. The MACD and moving averages indicate strength, but the RSI suggests caution. Market sentiment remains positive, but external factors could introduce volatility.
Confidence Level
Potential Risks
Unforeseen macroeconomic events could significantly impact the stock's trajectory.