SIF Trading Predictions
1 Day Prediction
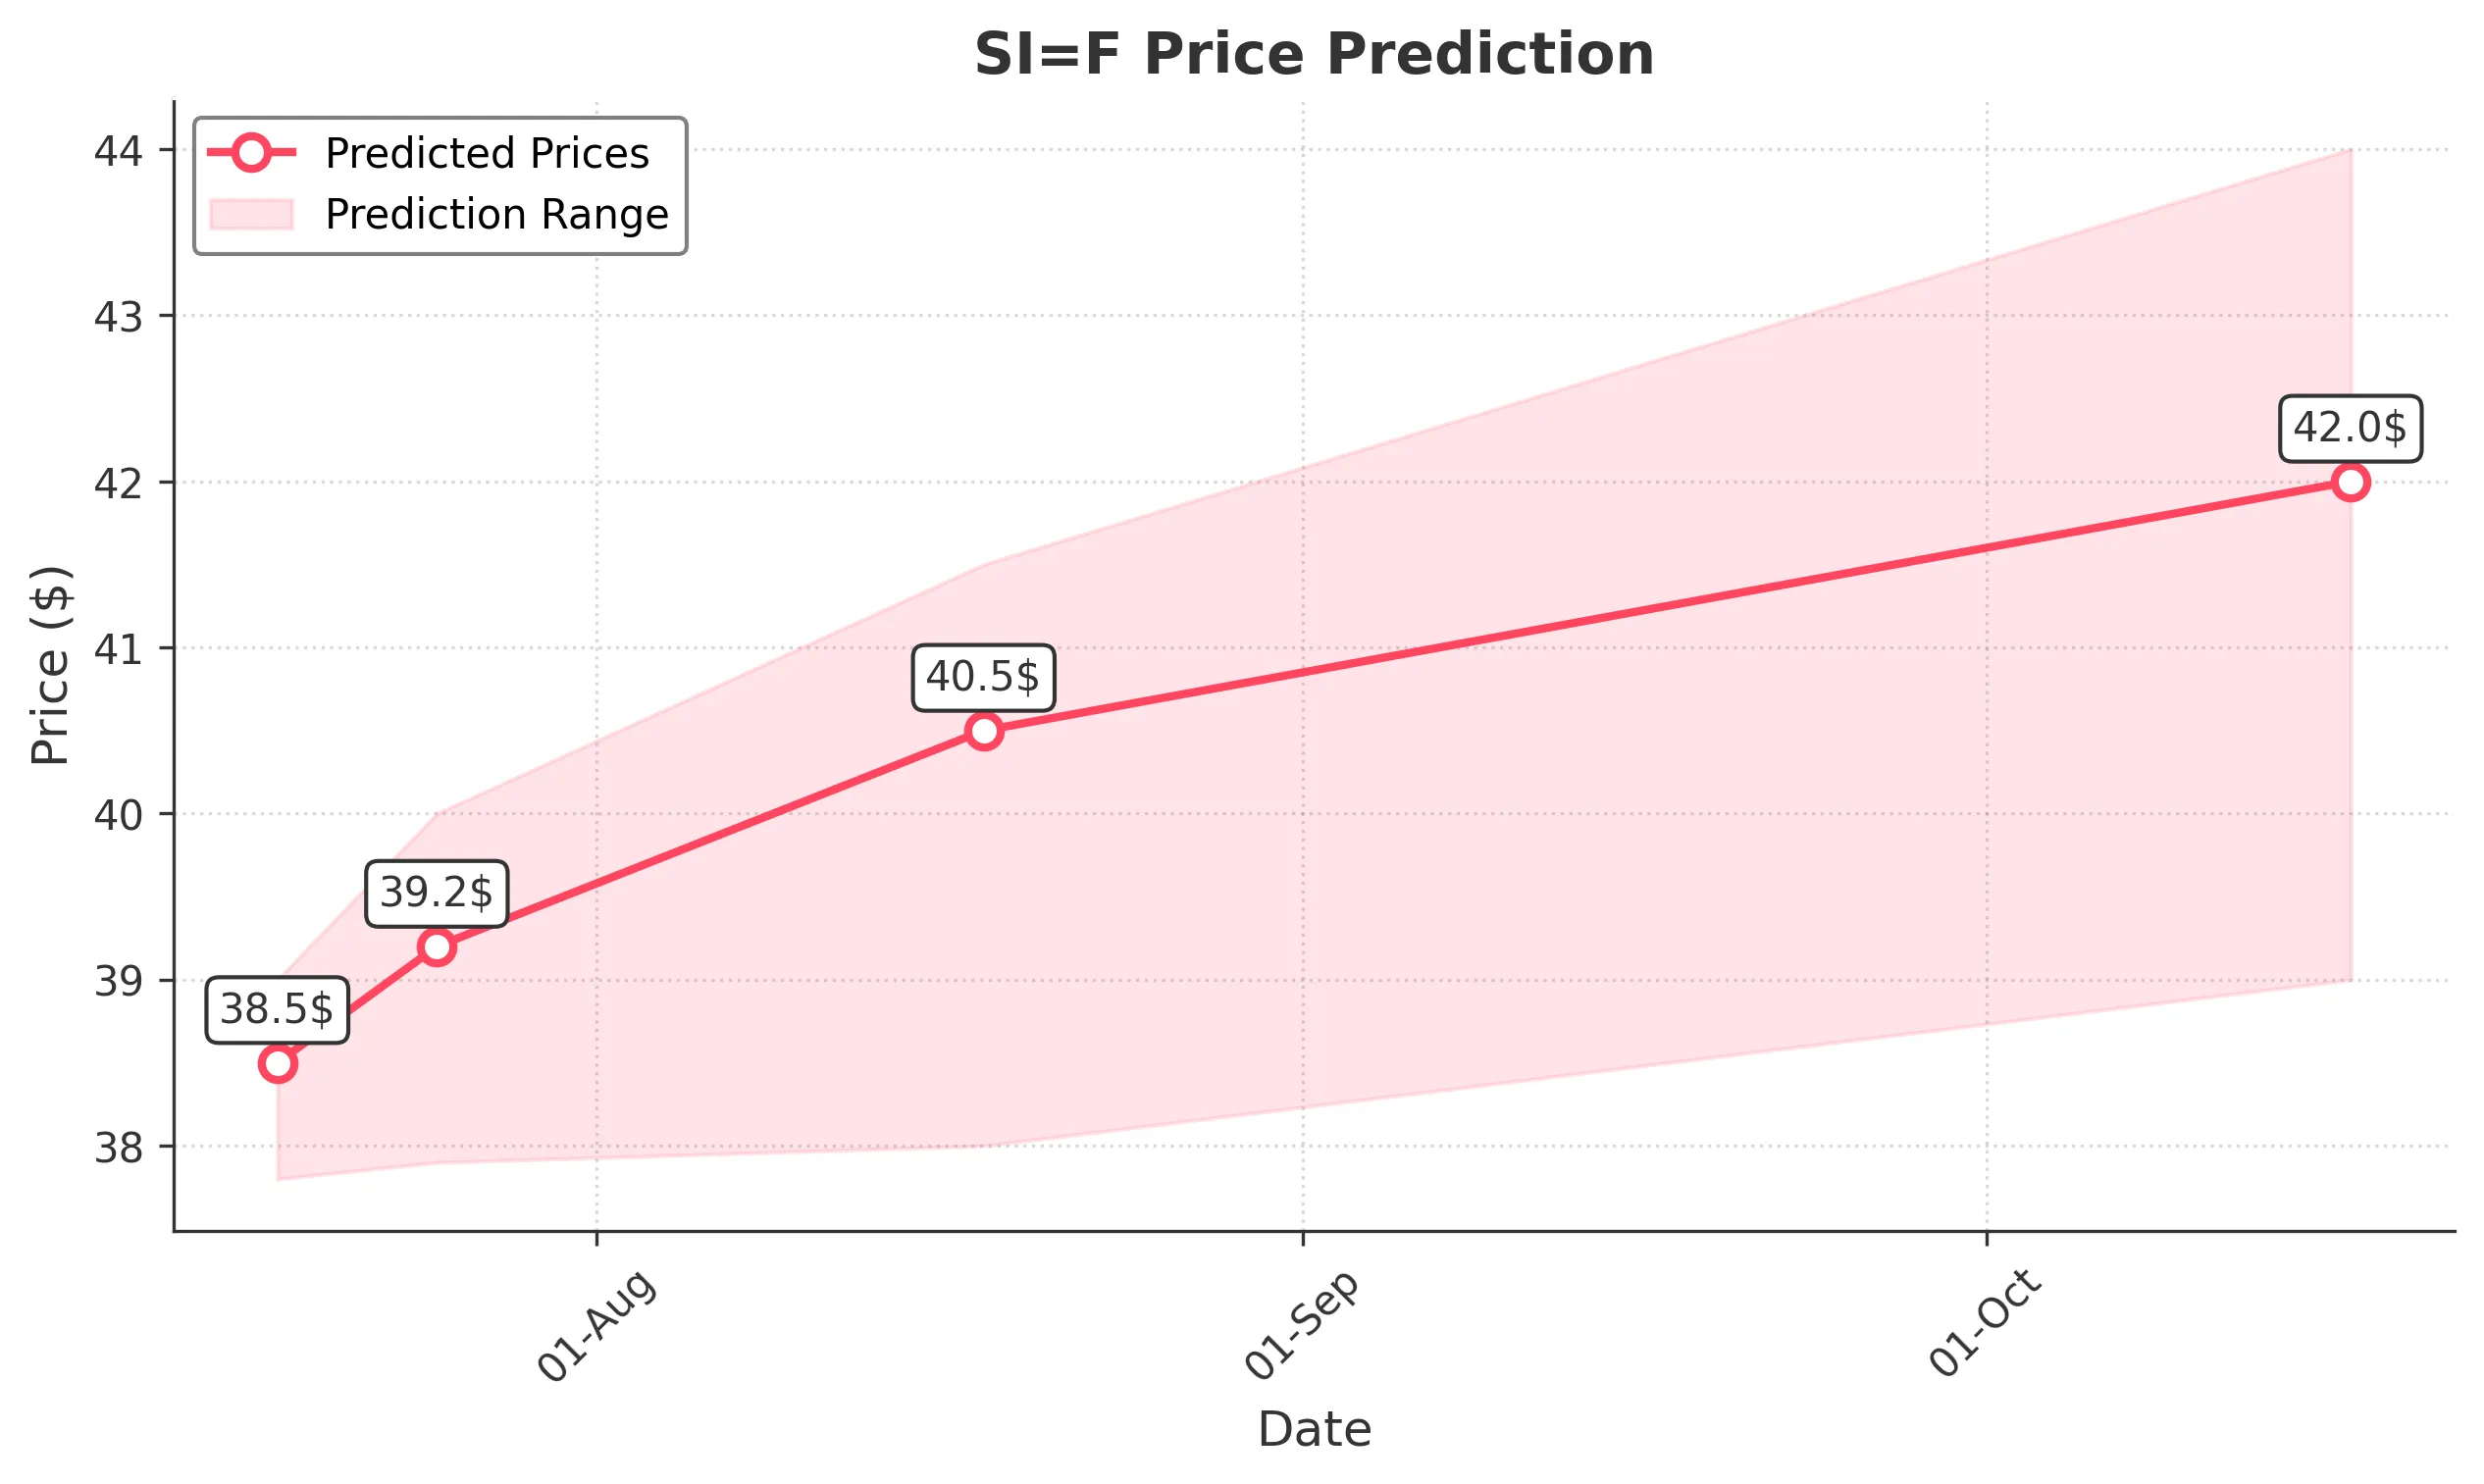
Target: July 18, 2025$38.5
$38.3
$39
$37.8
Description
The stock shows bullish momentum with a recent upward trend. The RSI is nearing overbought levels, indicating potential for a pullback. However, strong buying pressure may push prices higher. Watch for volume spikes as confirmation.
Analysis
Over the past 3 months, SI=F has shown a bullish trend, with significant support at 36.00 and resistance around 39.00. The MACD indicates upward momentum, while Bollinger Bands suggest volatility. Volume has been increasing, indicating strong interest.
Confidence Level
Potential Risks
Potential for a pullback if RSI exceeds 70. Market sentiment could shift quickly.
1 Week Prediction
Target: July 25, 2025$39.2
$38.8
$40
$37.9
Description
The stock is expected to continue its upward trajectory, supported by recent bullish candlestick patterns. However, the RSI indicates overbought conditions, suggesting a possible correction. Monitor for any bearish reversal signals.
Analysis
The stock has been in a strong uptrend, with key resistance at 39.00. The MACD is bullish, and the ATR indicates increasing volatility. Recent volume spikes suggest strong buying interest, but overbought conditions may lead to a pullback.
Confidence Level
Potential Risks
Market volatility and external news could impact price direction. Watch for bearish patterns.
1 Month Prediction
Target: August 18, 2025$40.5
$39.8
$41.5
$38
Description
The stock is likely to reach new highs as bullish sentiment persists. Fibonacci retracement levels suggest support at 38.00. However, watch for potential resistance at 41.00. A correction could occur if momentum wanes.
Analysis
SI=F has shown a strong bullish trend with significant support at 36.00 and resistance at 41.00. The MACD remains positive, and the RSI is approaching overbought territory. Volume patterns indicate strong interest, but caution is advised.
Confidence Level
Potential Risks
Unforeseen macroeconomic events could disrupt the bullish trend. Monitor for signs of weakening momentum.
3 Months Prediction
Target: October 17, 2025$42
$40.5
$44
$39
Description
Long-term bullish outlook as the stock may break through resistance levels. However, potential market corrections could occur. Monitor economic indicators and market sentiment closely.
Analysis
The stock has been on a bullish run, with key support at 39.00 and resistance at 44.00. The MACD is bullish, but the RSI indicates potential overbought conditions. Volume trends suggest strong interest, but external factors could introduce volatility.
Confidence Level
Potential Risks
Market conditions are unpredictable; economic downturns or negative news could impact performance significantly.