SIF Trading Predictions
1 Day Prediction
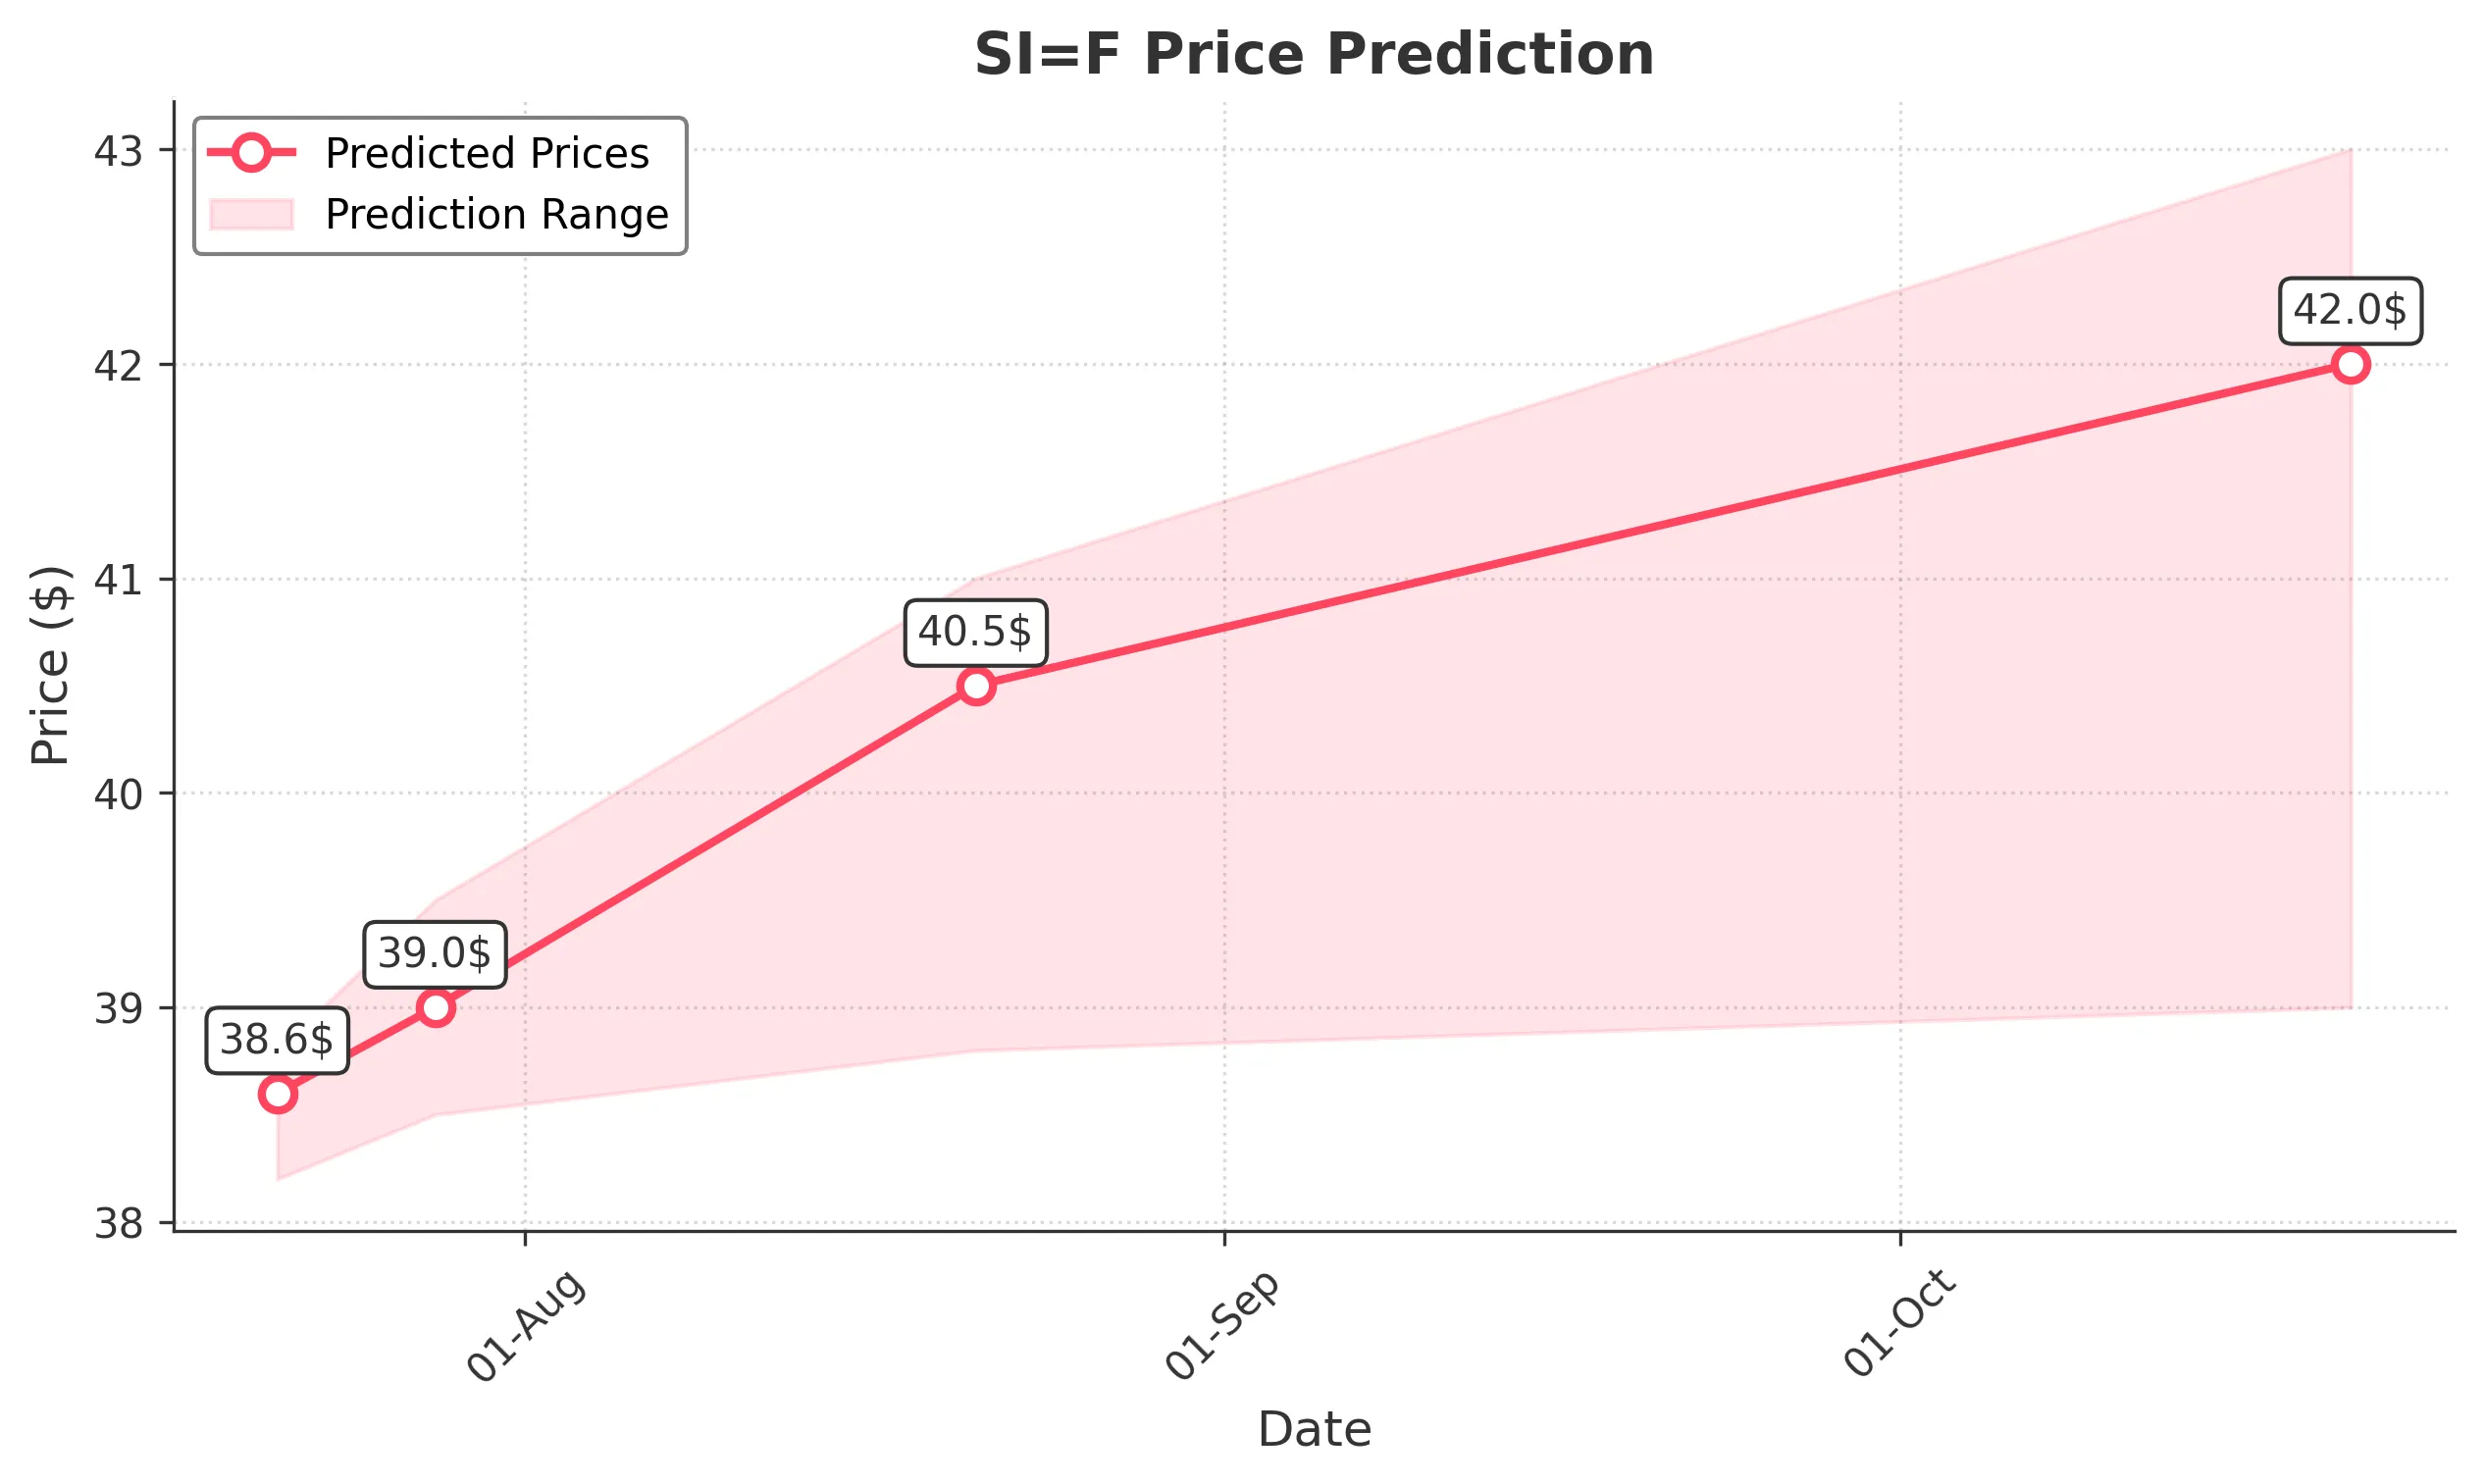
Target: July 21, 2025$38.6
$38.5
$38.8
$38.2
Description
The stock shows bullish momentum with a recent upward trend. The RSI is approaching overbought levels, indicating potential for a pullback. However, strong support at 38.00 and positive market sentiment suggest a slight increase in price.
Analysis
Over the past 3 months, SI=F has shown a bullish trend, with significant resistance at 39.00 and support around 36.00. The MACD indicates upward momentum, while volume spikes on recent days suggest strong buying interest. However, the RSI nearing overbought levels raises caution.
Confidence Level
Potential Risks
Potential for a pullback if RSI exceeds overbought levels. Market volatility could impact the prediction.
1 Week Prediction
Target: July 28, 2025$39
$38.8
$39.5
$38.5
Description
The stock is expected to continue its upward trajectory, supported by recent bullish candlestick patterns. The MACD remains positive, and the volume indicates sustained interest. However, the proximity to resistance at 39.00 may limit upside potential.
Analysis
The stock has been in a bullish phase, with key support at 36.00 and resistance at 39.00. The recent price action shows strong buying pressure, but the RSI indicates potential overbought conditions. Volume trends suggest continued interest, but caution is warranted.
Confidence Level
Potential Risks
Resistance at 39.00 could lead to a reversal. Market sentiment may shift due to external factors.
1 Month Prediction
Target: August 21, 2025$40.5
$39.5
$41
$38.8
Description
The stock is likely to break through the 39.00 resistance level, driven by strong bullish sentiment and positive technical indicators. The MACD and moving averages support upward momentum, although caution is advised as the RSI approaches overbought territory.
Analysis
SI=F has shown a strong bullish trend with significant support at 36.00. The recent price action indicates strong buying interest, but the RSI nearing overbought levels suggests a potential pullback. Volume patterns indicate sustained interest, but external factors could influence price movements.
Confidence Level
Potential Risks
Market corrections or negative news could impact the bullish trend. Watch for signs of reversal.
3 Months Prediction
Target: October 21, 2025$42
$40
$43
$39
Description
Long-term bullish sentiment is expected to prevail, with potential for further gains as the stock breaks key resistance levels. However, the market's volatility and external economic factors could introduce risks to this prediction.
Analysis
The stock has maintained a bullish trend, with key support at 36.00 and resistance at 39.00. The MACD and moving averages indicate upward momentum, but the RSI suggests potential overbought conditions. Volume trends show strong interest, but external factors could impact future performance.
Confidence Level
Potential Risks
Unforeseen macroeconomic events or shifts in market sentiment could lead to volatility. Watch for signs of reversal.