SIF Trading Predictions
1 Day Prediction
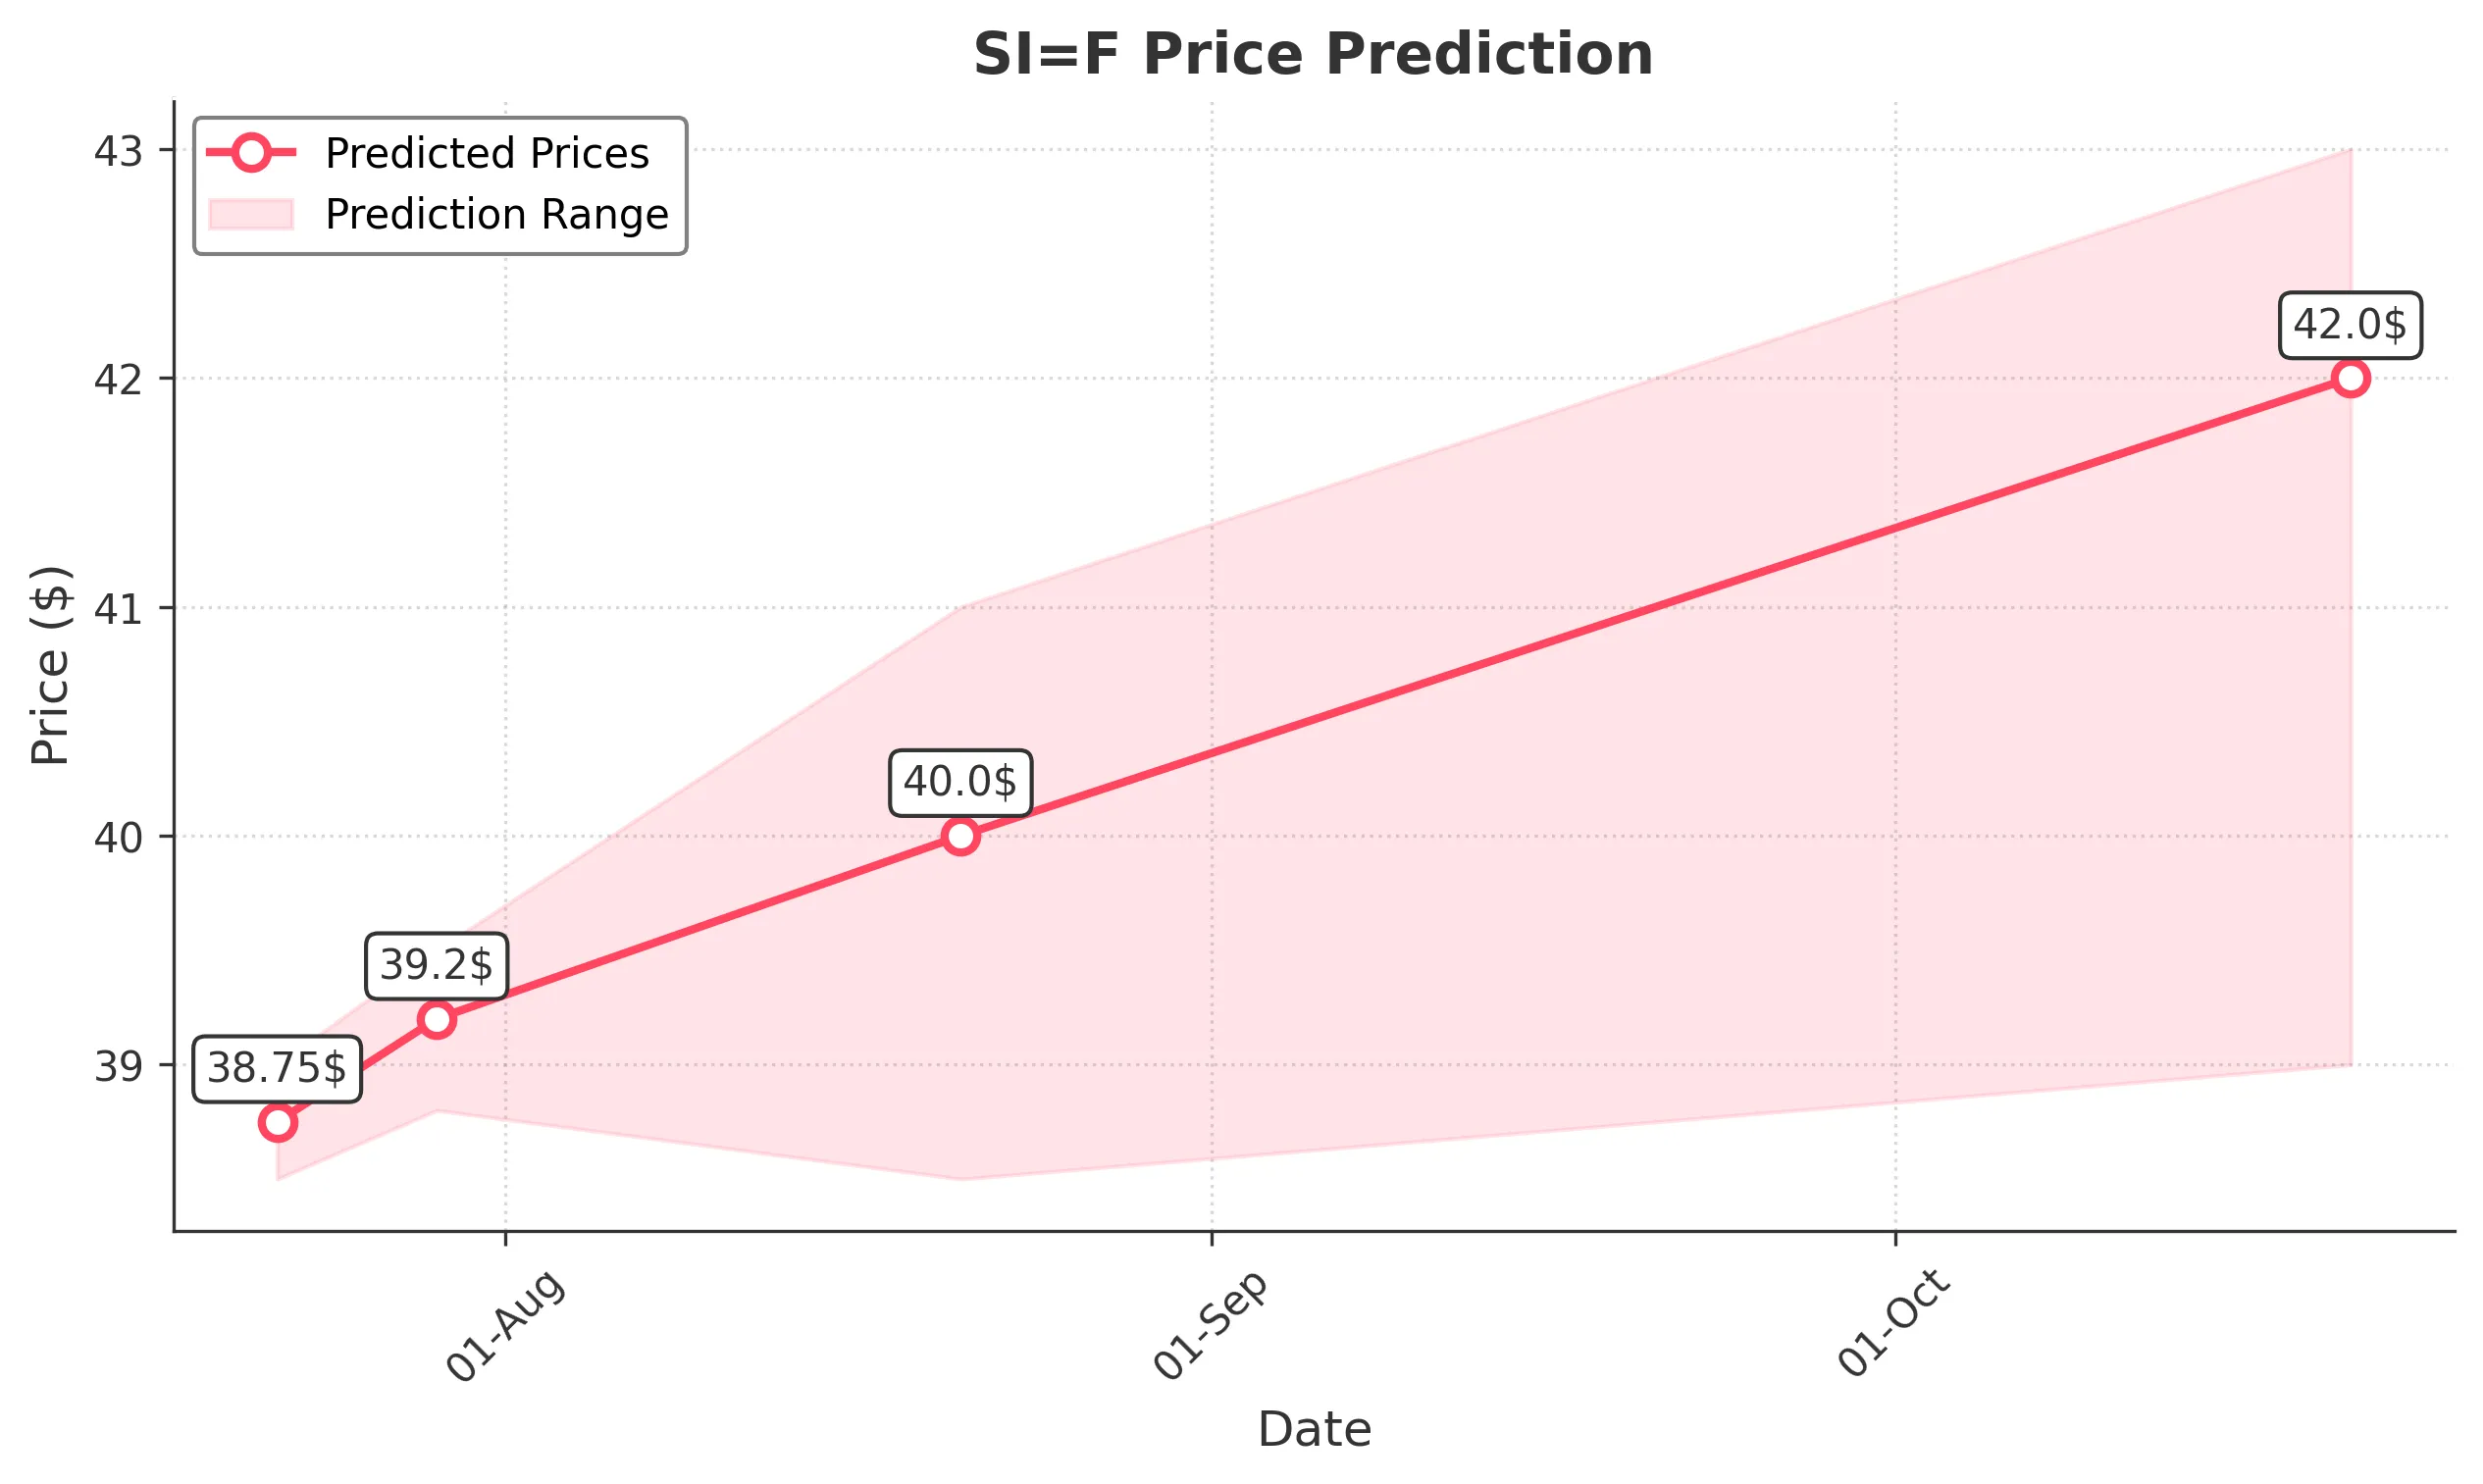
Target: July 22, 2025$38.75
$38.6
$39
$38.5
Description
The stock shows bullish momentum with a recent upward trend. The RSI is approaching overbought levels, indicating potential for a pullback. However, strong buying pressure may push the price higher in the short term.
Analysis
Over the past 3 months, SI=F has shown a bullish trend, with significant upward movements. Key resistance is around 39.00, while support is at 36.00. Volume has been increasing, indicating strong interest. The MACD is bullish, but RSI suggests caution.
Confidence Level
Potential Risks
Potential for a pullback due to overbought RSI and market volatility.
1 Week Prediction
Target: July 29, 2025$39.2
$38.9
$39.5
$38.8
Description
The stock is expected to continue its upward trajectory, supported by strong volume and bullish candlestick patterns. However, the RSI indicates potential overbought conditions, which could lead to a correction.
Analysis
The stock has been in a bullish phase, with key resistance at 39.50. The MACD is positive, and volume spikes suggest strong buying interest. However, the RSI nearing overbought levels raises concerns about a potential pullback.
Confidence Level
Potential Risks
Market sentiment may shift, leading to unexpected volatility.
1 Month Prediction
Target: August 21, 2025$40
$39.5
$41
$38.5
Description
The stock is likely to reach new highs as bullish momentum persists. The Fibonacci retracement levels suggest a target around 40.00. However, caution is advised as the RSI may indicate overbought conditions.
Analysis
SI=F has shown strong bullish trends, with significant support at 38.50. The MACD remains bullish, and volume patterns indicate strong interest. However, the RSI suggests potential overbought conditions, warranting caution.
Confidence Level
Potential Risks
Possible market corrections and external economic factors could impact performance.
3 Months Prediction
Target: October 21, 2025$42
$40.5
$43
$39
Description
Long-term bullish sentiment is expected to drive the stock higher, with potential to reach 42.00. However, macroeconomic factors and market corrections could introduce volatility.
Analysis
The stock has maintained a bullish trend, with key resistance at 43.00. The MACD is positive, but the RSI indicates potential overbought conditions. Volume patterns suggest strong interest, but external factors may introduce volatility.
Confidence Level
Potential Risks
Unforeseen economic events and market sentiment shifts could lead to price fluctuations.