SIF Trading Predictions
1 Day Prediction
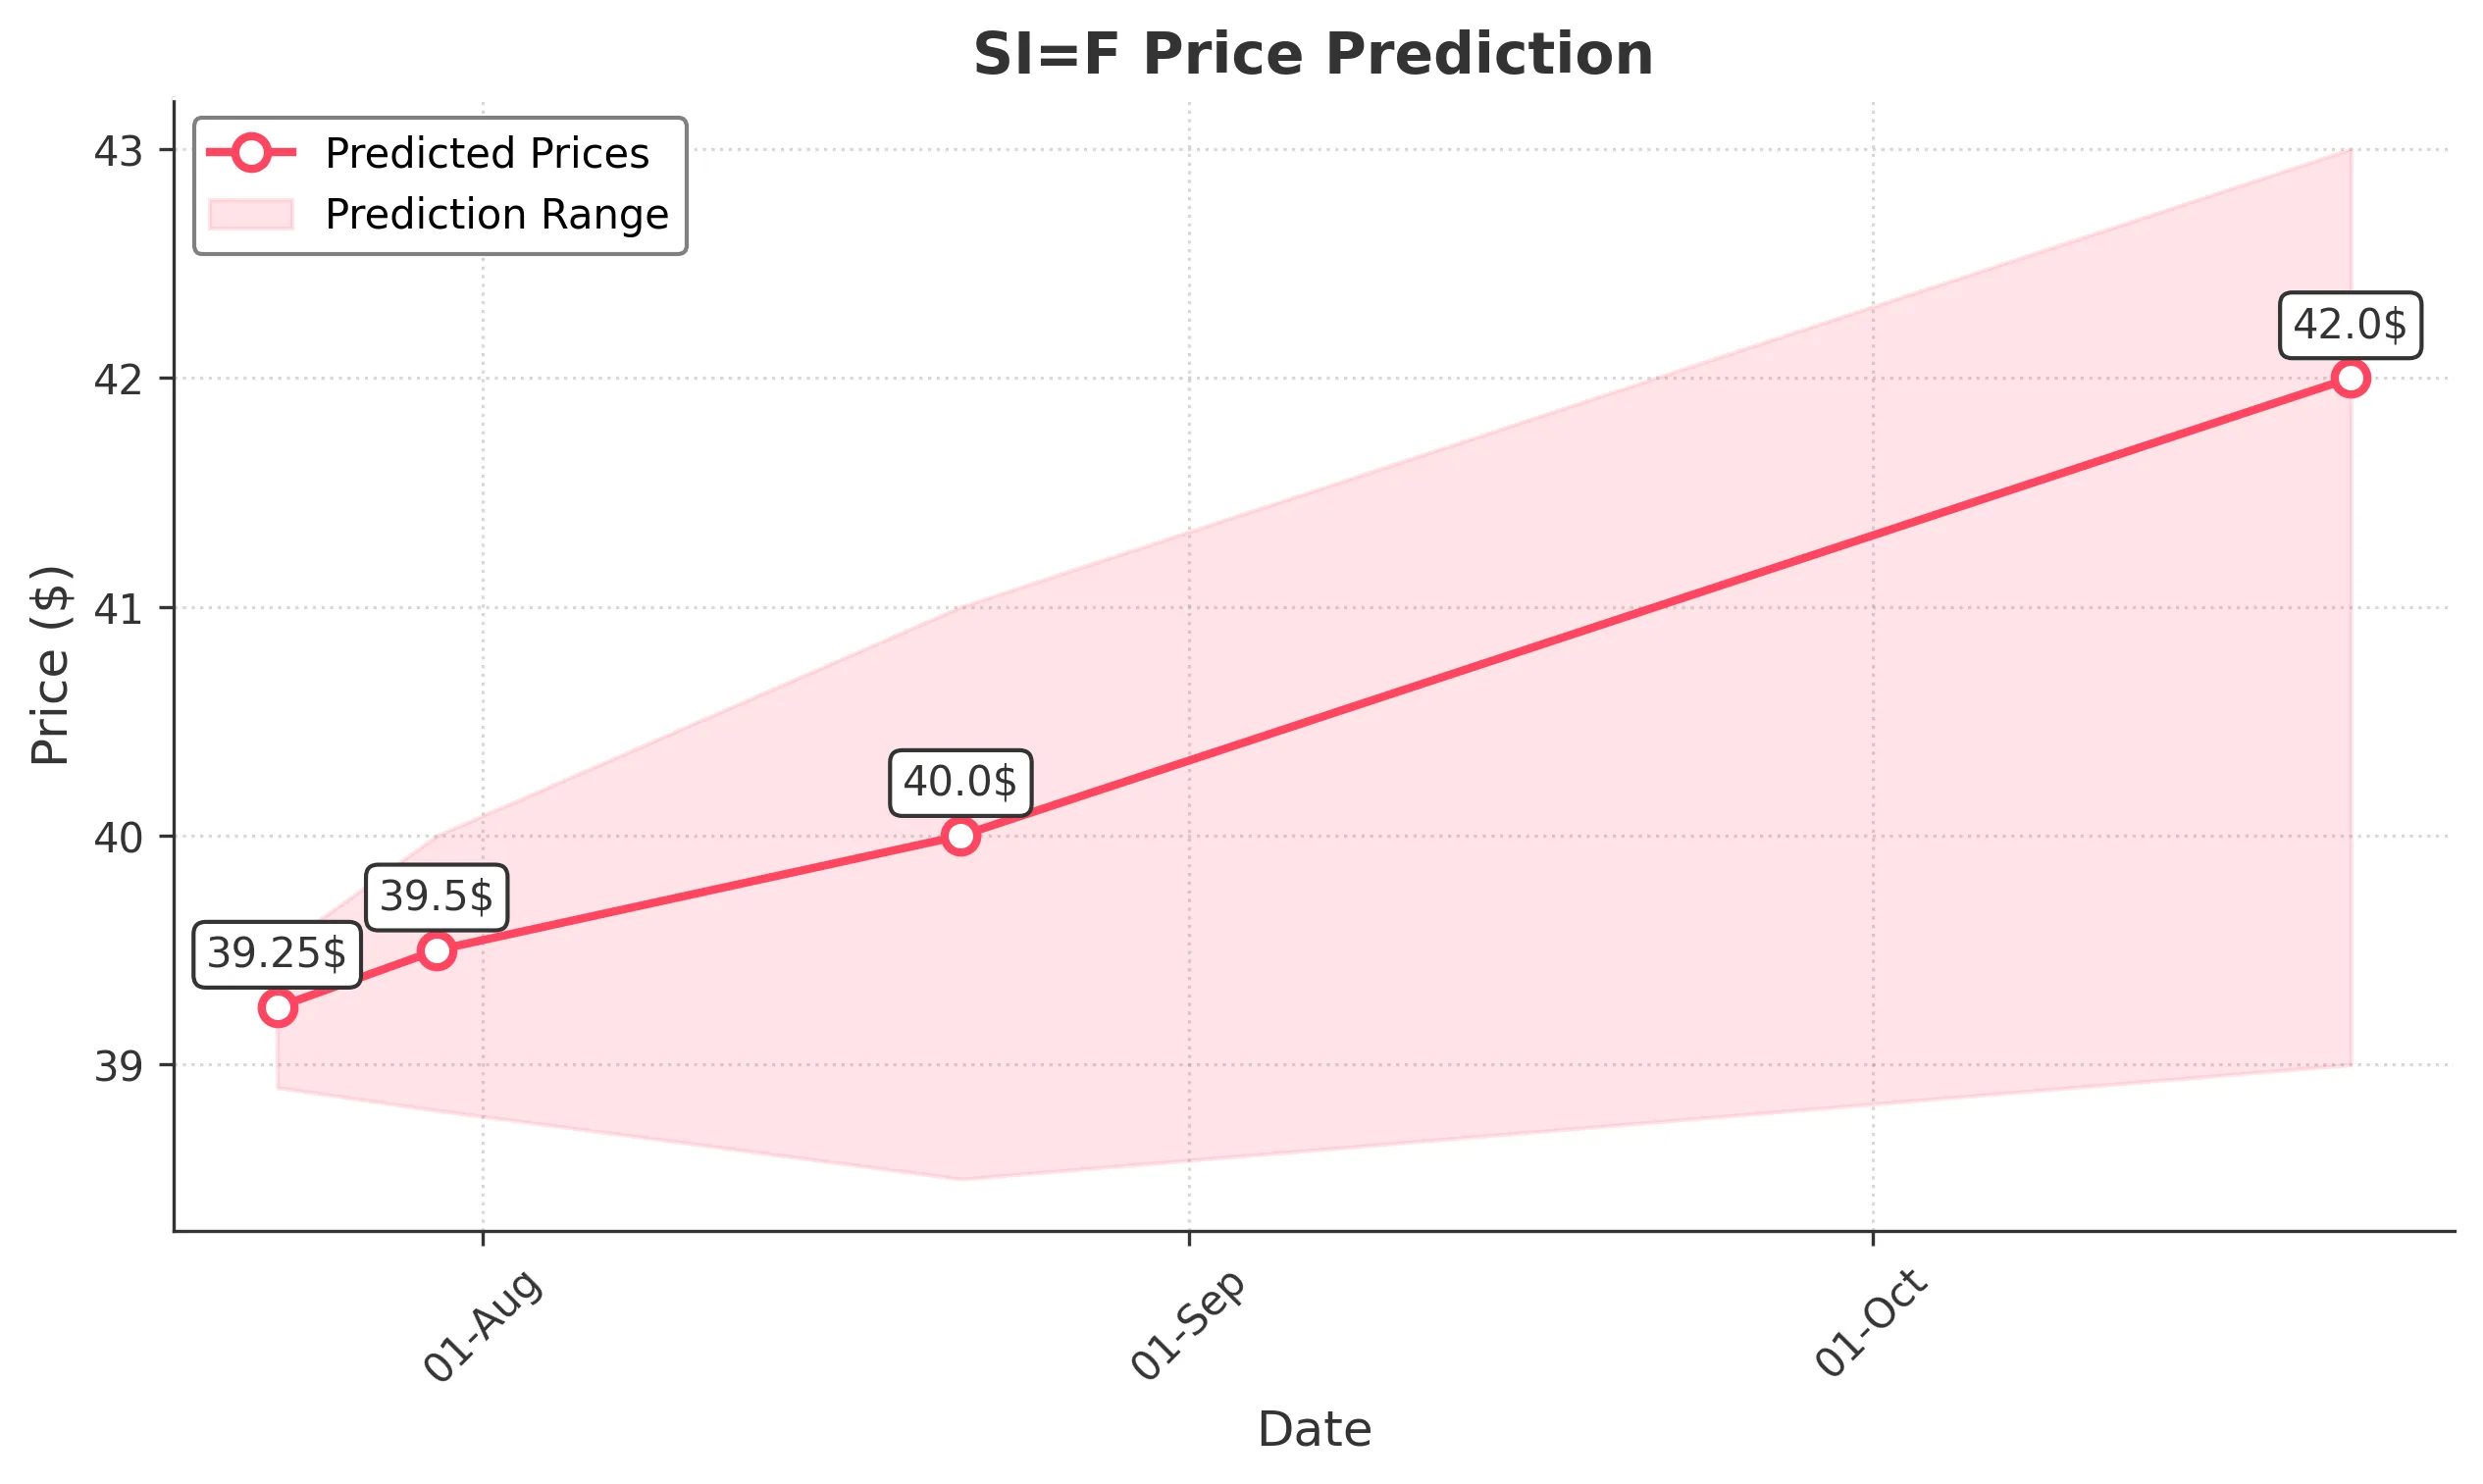
Target: July 23, 2025$39.25
$39.2
$39.5
$38.9
Description
The stock shows bullish momentum with a recent close at 39.12. The RSI is approaching overbought levels, indicating potential for a pullback. However, strong volume and upward price action suggest a continuation of the trend in the short term.
Analysis
The stock has been in a bullish trend, recently breaking above key resistance at 39.00. The MACD is positive, and the volume has been increasing, indicating strong buying interest. However, the RSI nearing overbought levels suggests caution.
Confidence Level
Potential Risks
Potential reversal signals from overbought RSI and market volatility could impact the prediction.
1 Week Prediction
Target: July 30, 2025$39.5
$39.3
$40
$38.8
Description
The stock is expected to maintain its upward trajectory, supported by strong recent performance. The bullish candlestick patterns and positive MACD signal further gains, although the RSI indicates potential overbought conditions.
Analysis
The stock has shown consistent upward movement, with significant support at 38.50. The recent high of 39.12 indicates strong bullish sentiment. However, the RSI suggests caution as it approaches overbought territory, which could lead to a pullback.
Confidence Level
Potential Risks
Market sentiment shifts or external economic factors could lead to unexpected volatility.
1 Month Prediction
Target: August 22, 2025$40
$39.8
$41
$38.5
Description
The stock is projected to reach 40.00 as it continues to capitalize on bullish momentum. The Fibonacci retracement levels support this target, but caution is advised due to potential resistance at 40.50.
Analysis
The stock has been trending upward, with key support at 38.50 and resistance at 40.50. The MACD remains bullish, but the RSI indicates overbought conditions. Volume patterns suggest strong interest, but external factors could impact performance.
Confidence Level
Potential Risks
Market corrections or negative news could hinder upward movement, leading to volatility.
3 Months Prediction
Target: October 22, 2025$42
$41.5
$43
$39
Description
Long-term bullish sentiment is expected to drive the stock to 42.00, supported by strong fundamentals and market trends. However, potential resistance at 43.00 may pose challenges.
Analysis
The stock has shown a strong bullish trend, with key support at 39.00. The MACD is positive, indicating upward momentum, but the RSI suggests caution. External economic factors and market sentiment will be crucial in determining future performance.
Confidence Level
Potential Risks
Economic shifts or changes in market sentiment could lead to significant volatility and impact the prediction.