SIF Trading Predictions
1 Day Prediction
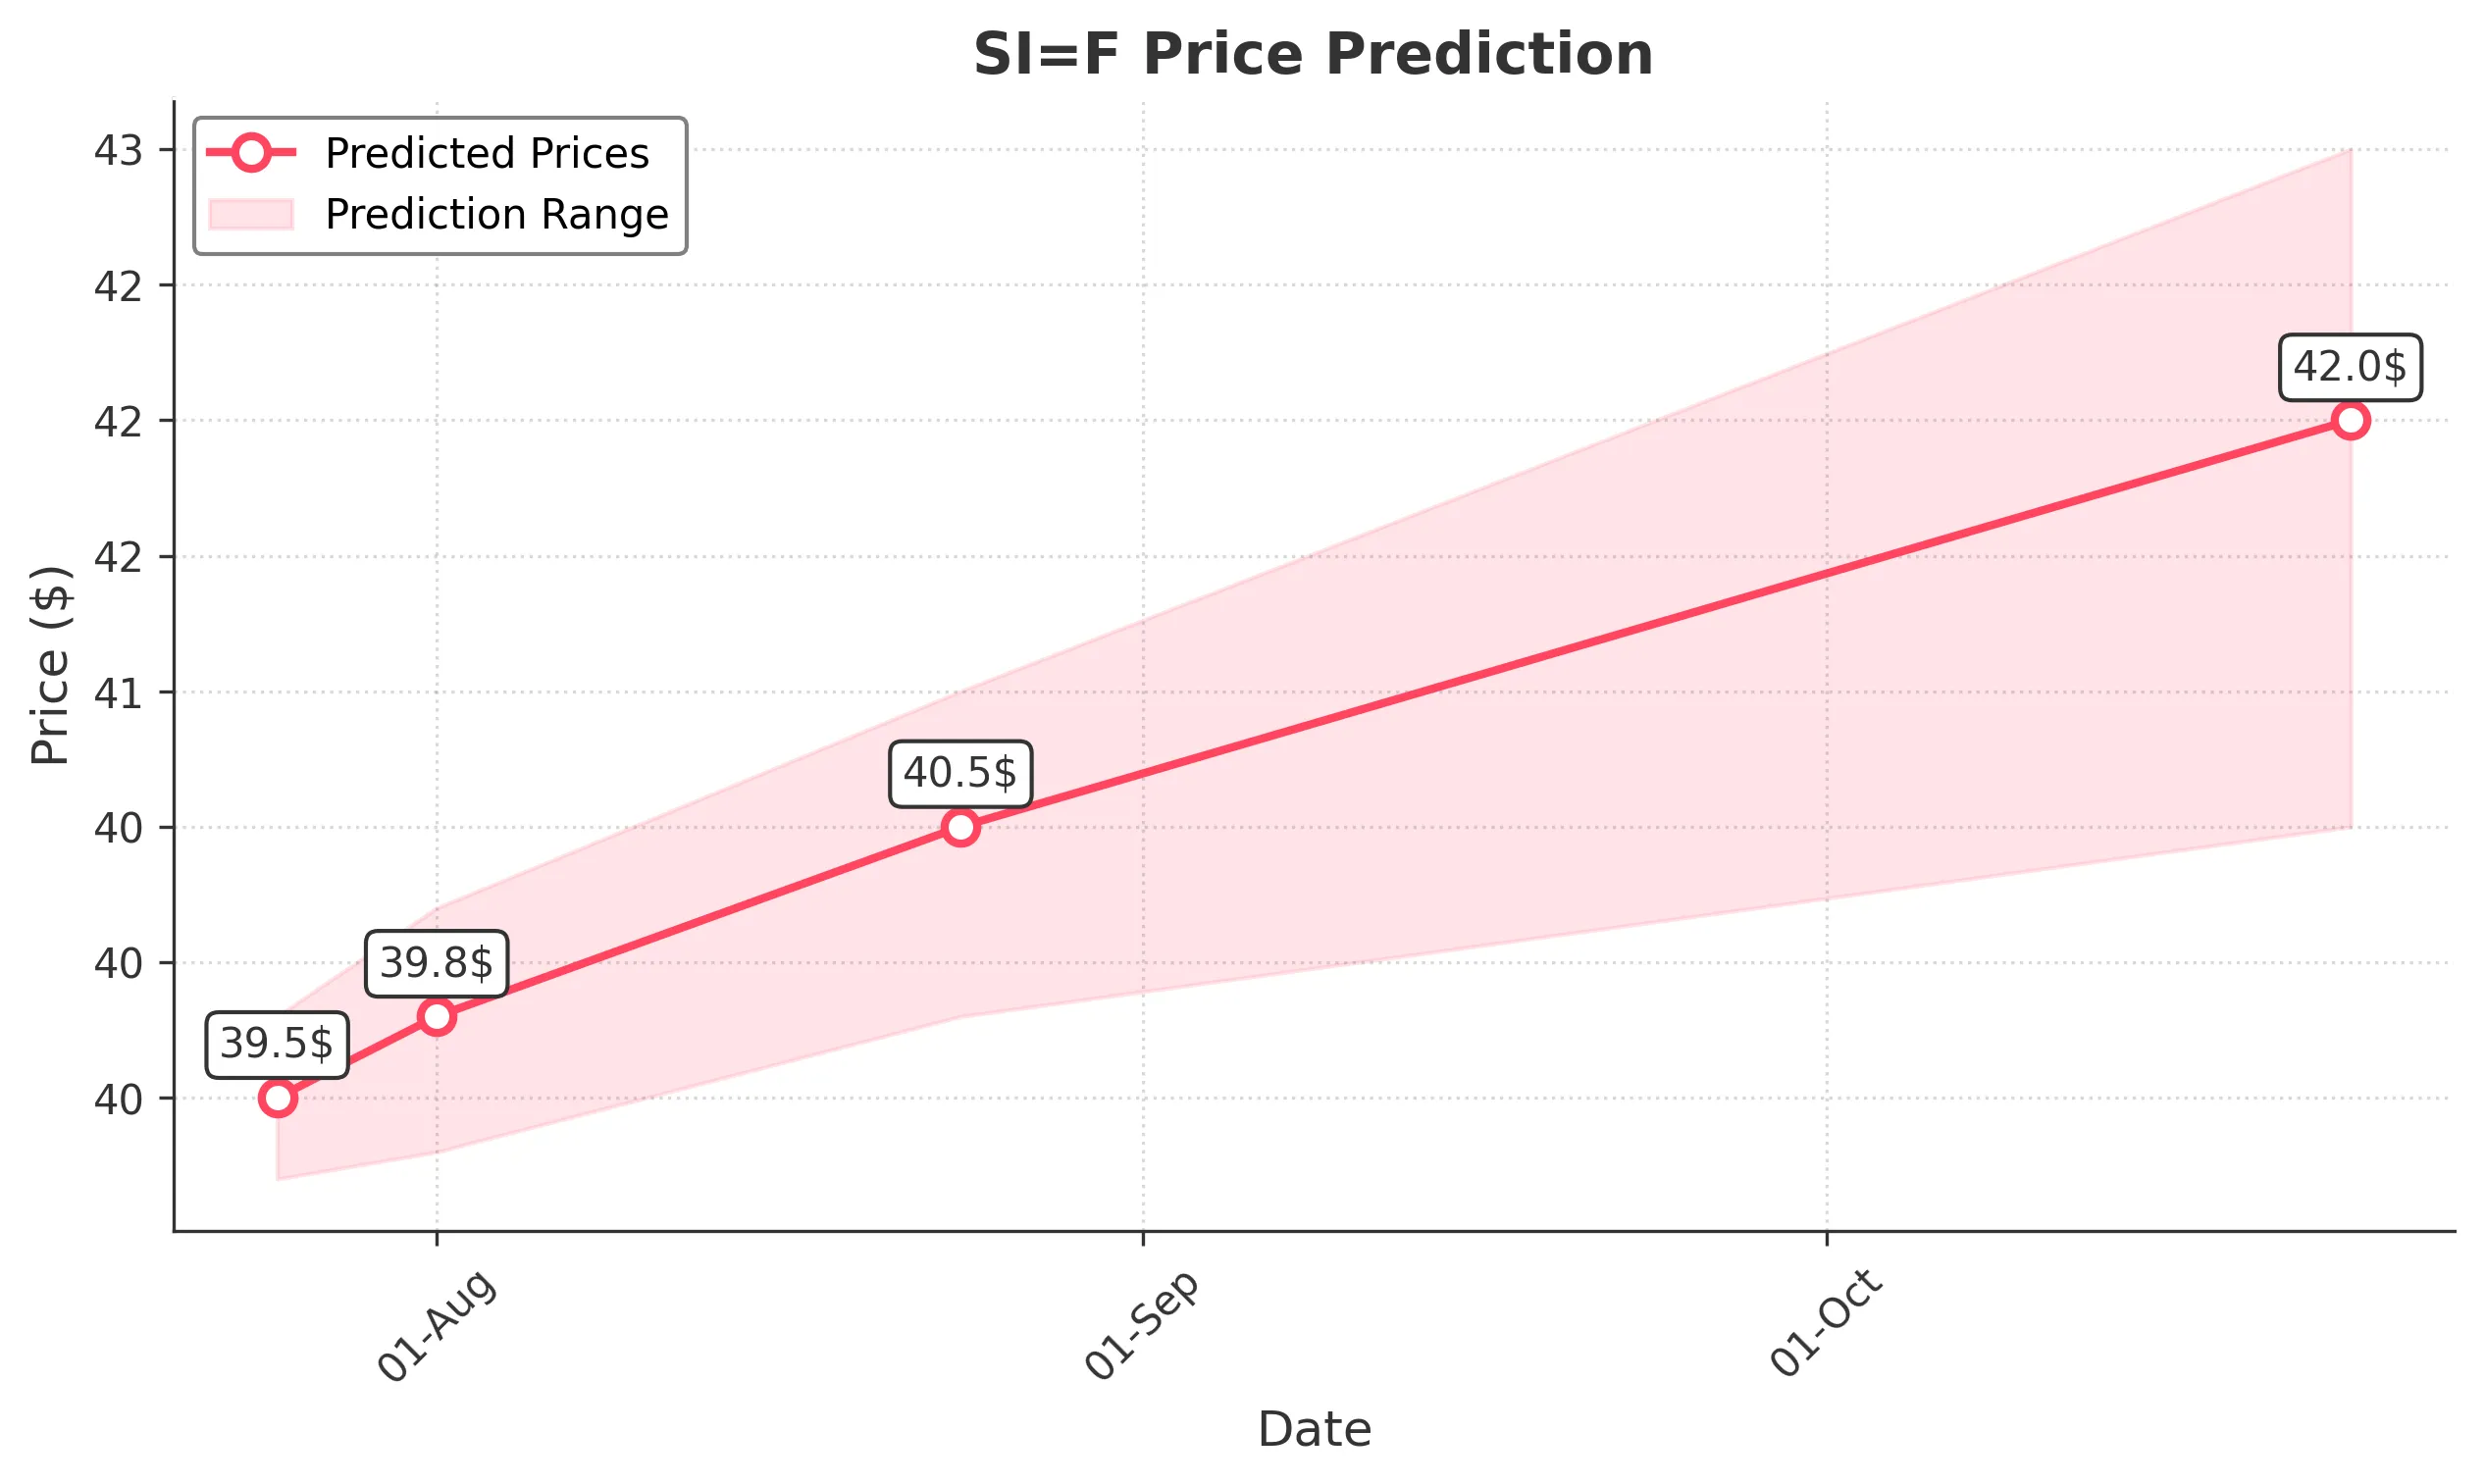
Target: July 25, 2025$39.5
$39.3
$39.8
$39.2
Description
The stock shows bullish momentum with a recent close above 39.00. The RSI indicates overbought conditions, suggesting a potential pullback. However, strong support at 39.00 may hold, leading to a slight upward movement.
Analysis
The stock has been in a bullish trend, recently breaking above 39.00. Key resistance is at 39.80. Volume has been increasing, indicating strong interest. However, the RSI suggests caution as it approaches overbought territory.
Confidence Level
Potential Risks
Potential for a reversal exists due to overbought RSI levels and market volatility.
1 Week Prediction
Target: August 1, 2025$39.8
$39.5
$40.2
$39.3
Description
The stock is expected to continue its upward trend, supported by recent bullish candlestick patterns. The MACD shows a bullish crossover, indicating potential for further gains. Watch for resistance at 40.00.
Analysis
The stock has shown strong upward momentum, with significant support at 39.00. The MACD and moving averages indicate bullish signals. However, external economic events could introduce volatility.
Confidence Level
Potential Risks
Market sentiment could shift due to external economic factors, impacting the bullish outlook.
1 Month Prediction
Target: August 24, 2025$40.5
$39.9
$41
$39.8
Description
With continued bullish momentum and strong support levels, the stock is likely to reach 40.50. The Fibonacci retracement levels support this target, but watch for potential resistance at 41.00.
Analysis
The stock has been trending upward, with key support at 39.00 and resistance at 41.00. The volume has been increasing, indicating strong buying interest. However, external factors could introduce uncertainty.
Confidence Level
Potential Risks
Economic data releases could impact market sentiment and lead to volatility.
3 Months Prediction
Target: October 24, 2025$42
$41
$43
$40.5
Description
The stock is expected to maintain its bullish trend, potentially reaching 42.00. The overall market sentiment remains positive, but watch for any signs of reversal as the stock approaches key resistance levels.
Analysis
The stock has shown a strong bullish trend over the past months, with significant support at 39.00. However, potential resistance at 43.00 could limit upside movement. Economic conditions and market sentiment will be crucial.
Confidence Level
Potential Risks
Long-term predictions are subject to market volatility and economic changes that could affect performance.