SIF Trading Predictions
1 Day Prediction
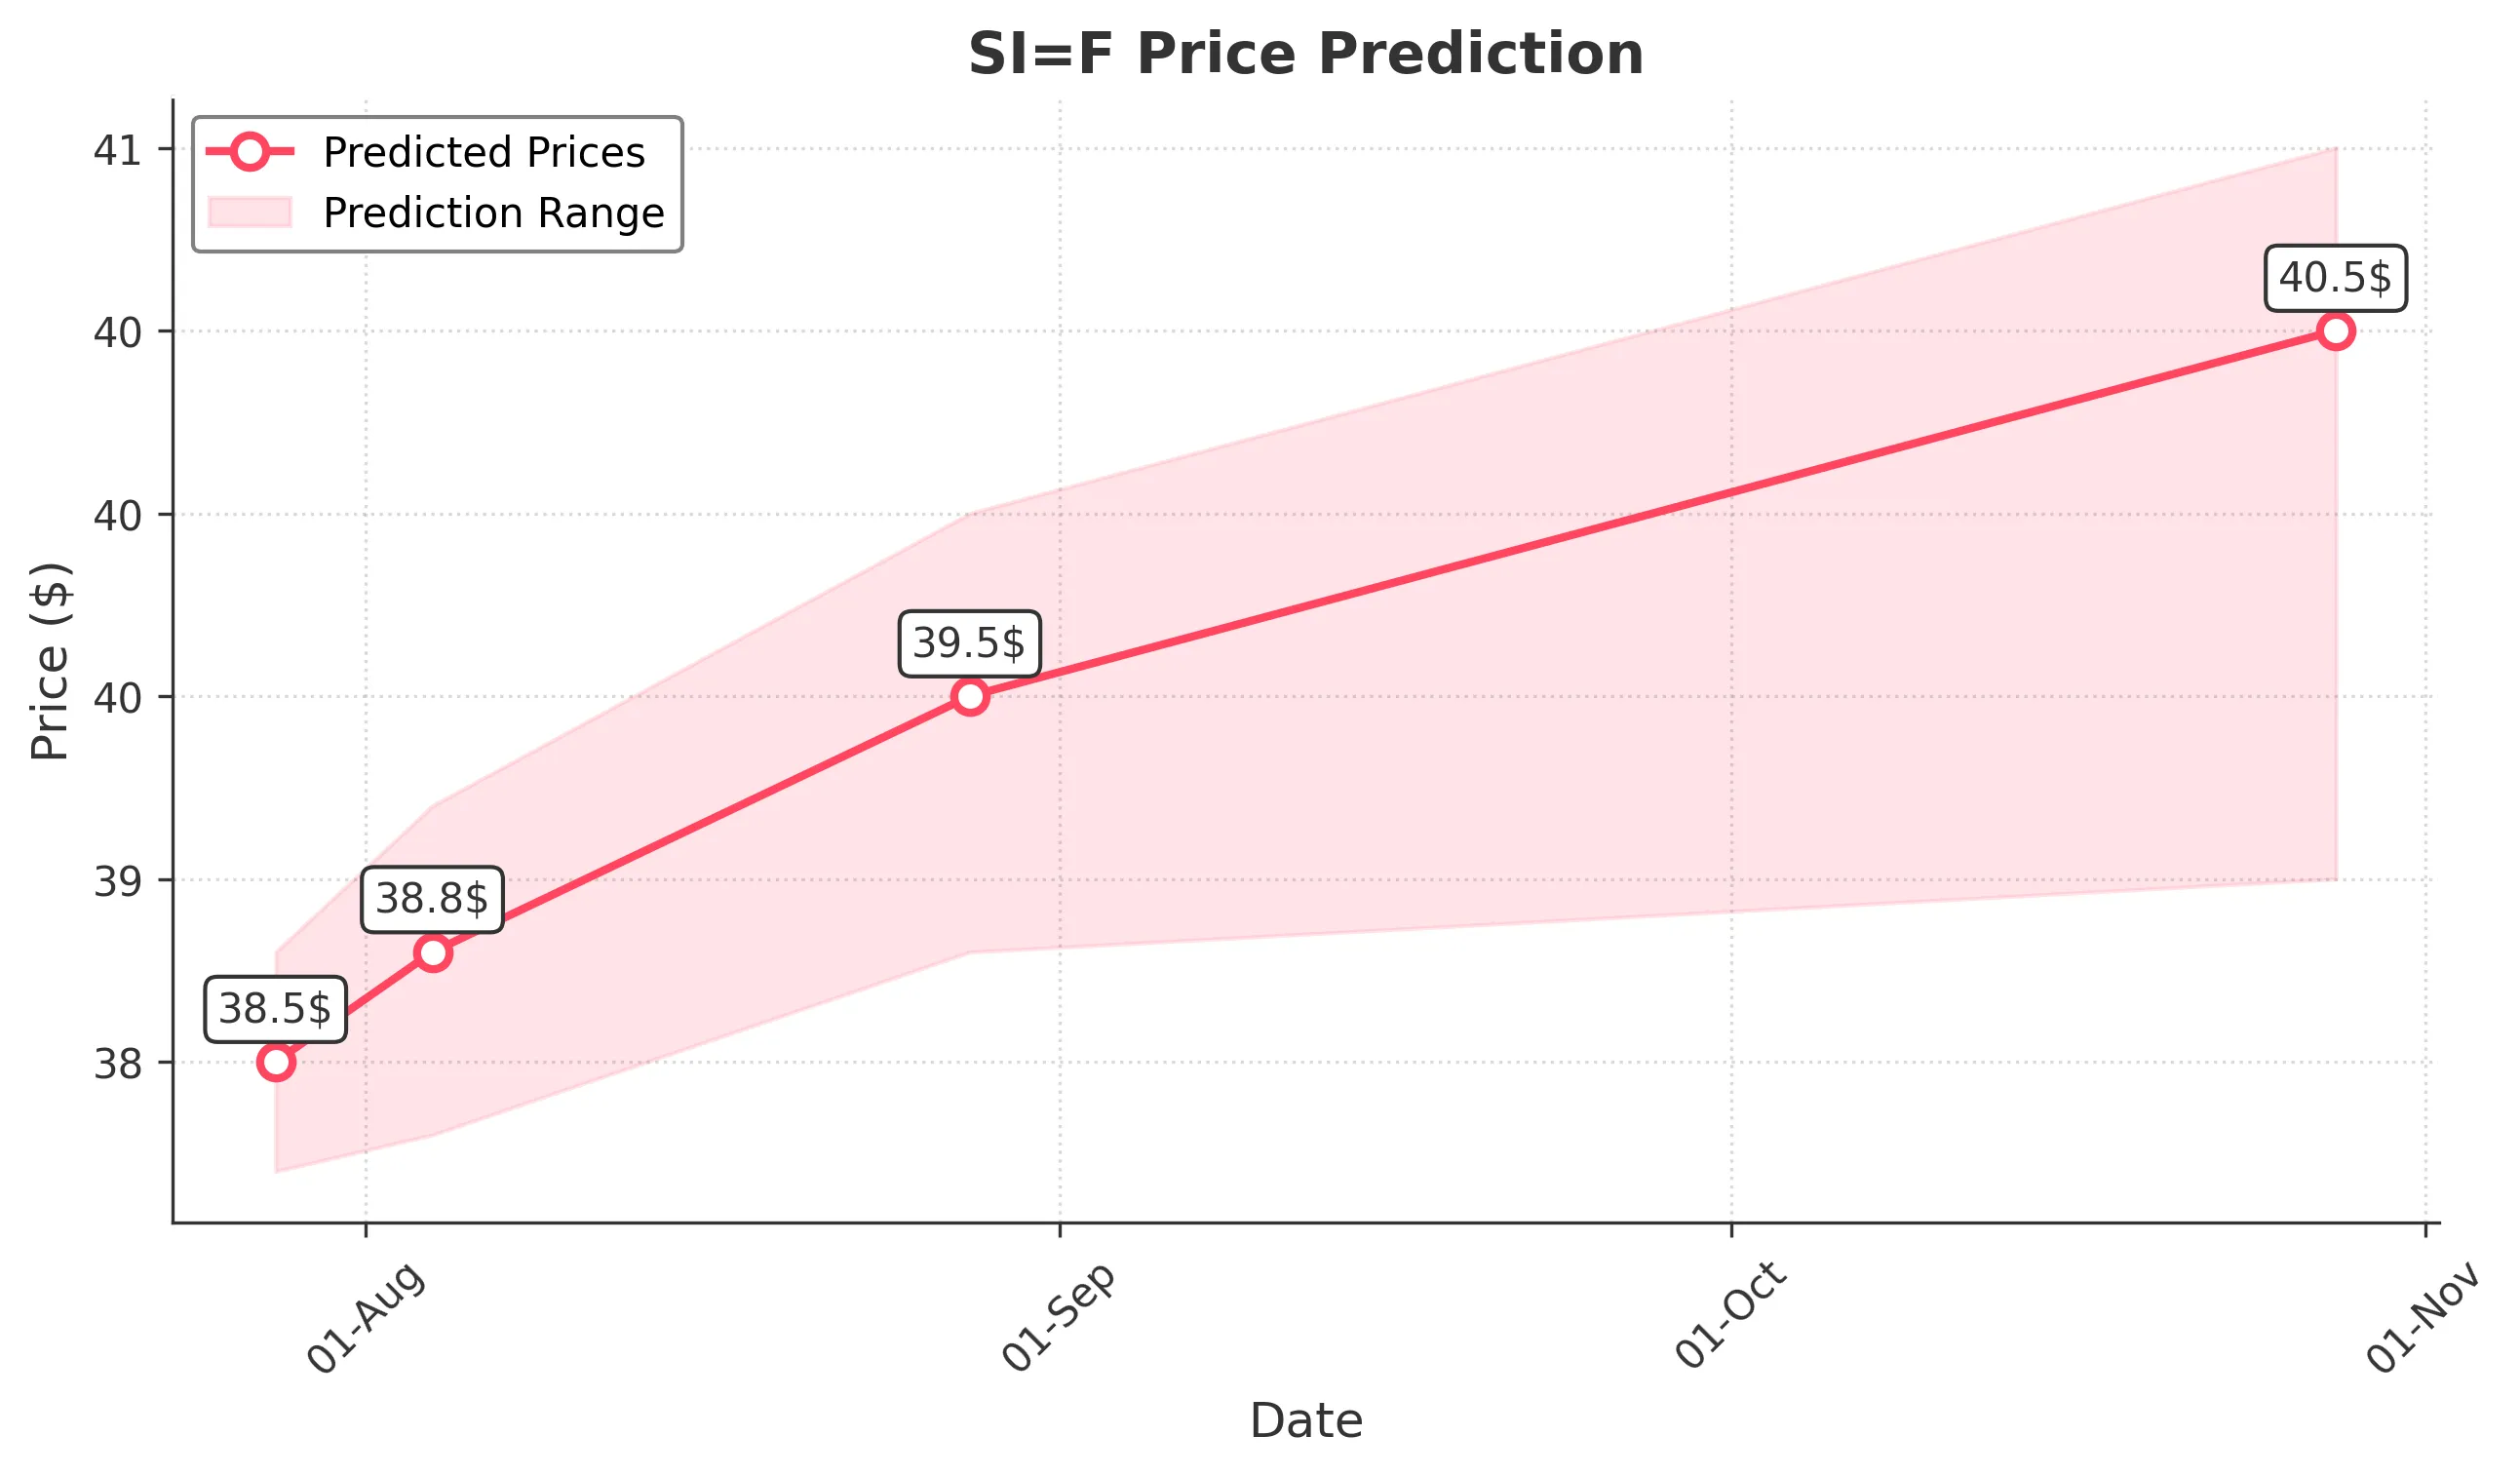
Target: July 28, 2025$38.5
$38.4
$38.8
$38.2
Description
The stock shows a slight bullish trend with a recent upward movement. The RSI is approaching overbought levels, indicating potential resistance. A Doji pattern suggests indecision, but overall sentiment remains positive.
Analysis
Over the past 3 months, SI=F has shown a bullish trend with significant upward movements. Key resistance is around 39.3, while support is at 37.8. The MACD indicates bullish momentum, but the RSI suggests caution as it nears overbought territory.
Confidence Level
Potential Risks
Potential reversal due to overbought conditions and market volatility could impact the prediction.
1 Week Prediction
Target: August 4, 2025$38.8
$38.6
$39.2
$38.3
Description
The stock is expected to maintain its bullish trend, supported by recent price action. However, the RSI indicates potential overbought conditions, which may lead to a pullback. Watch for volume spikes as a signal of trend strength.
Analysis
The stock has been trending upward, with strong resistance at 39.3. The MACD is bullish, but the ATR indicates increasing volatility. Volume has been stable, but any significant news could impact the trend.
Confidence Level
Potential Risks
Market sentiment could shift due to external factors, and a correction may occur if the RSI continues to rise.
1 Month Prediction
Target: August 28, 2025$39.5
$39.2
$40
$38.8
Description
The stock is likely to continue its upward trajectory, driven by strong market sentiment and positive technical indicators. However, the potential for a pullback exists as the stock approaches key resistance levels.
Analysis
The stock has shown consistent bullish behavior, with key support at 37.8 and resistance at 39.3. The MACD remains positive, and the RSI is approaching overbought levels, indicating caution for potential corrections.
Confidence Level
Potential Risks
Unforeseen macroeconomic events or earnings reports could lead to volatility and affect the prediction.
3 Months Prediction
Target: October 28, 2025$40.5
$40.2
$41
$39
Description
Long-term bullish sentiment is expected to prevail, with the stock likely breaking through resistance levels. However, the potential for market corrections remains, especially if economic conditions change.
Analysis
The stock has been on a bullish trend, with significant upward momentum. Key resistance is at 40.0, while support is at 38.0. The MACD indicates continued bullish momentum, but the RSI suggests caution as it approaches overbought territory.
Confidence Level
Potential Risks
Economic downturns or changes in market sentiment could lead to unexpected price movements.