SIF Trading Predictions
1 Day Prediction
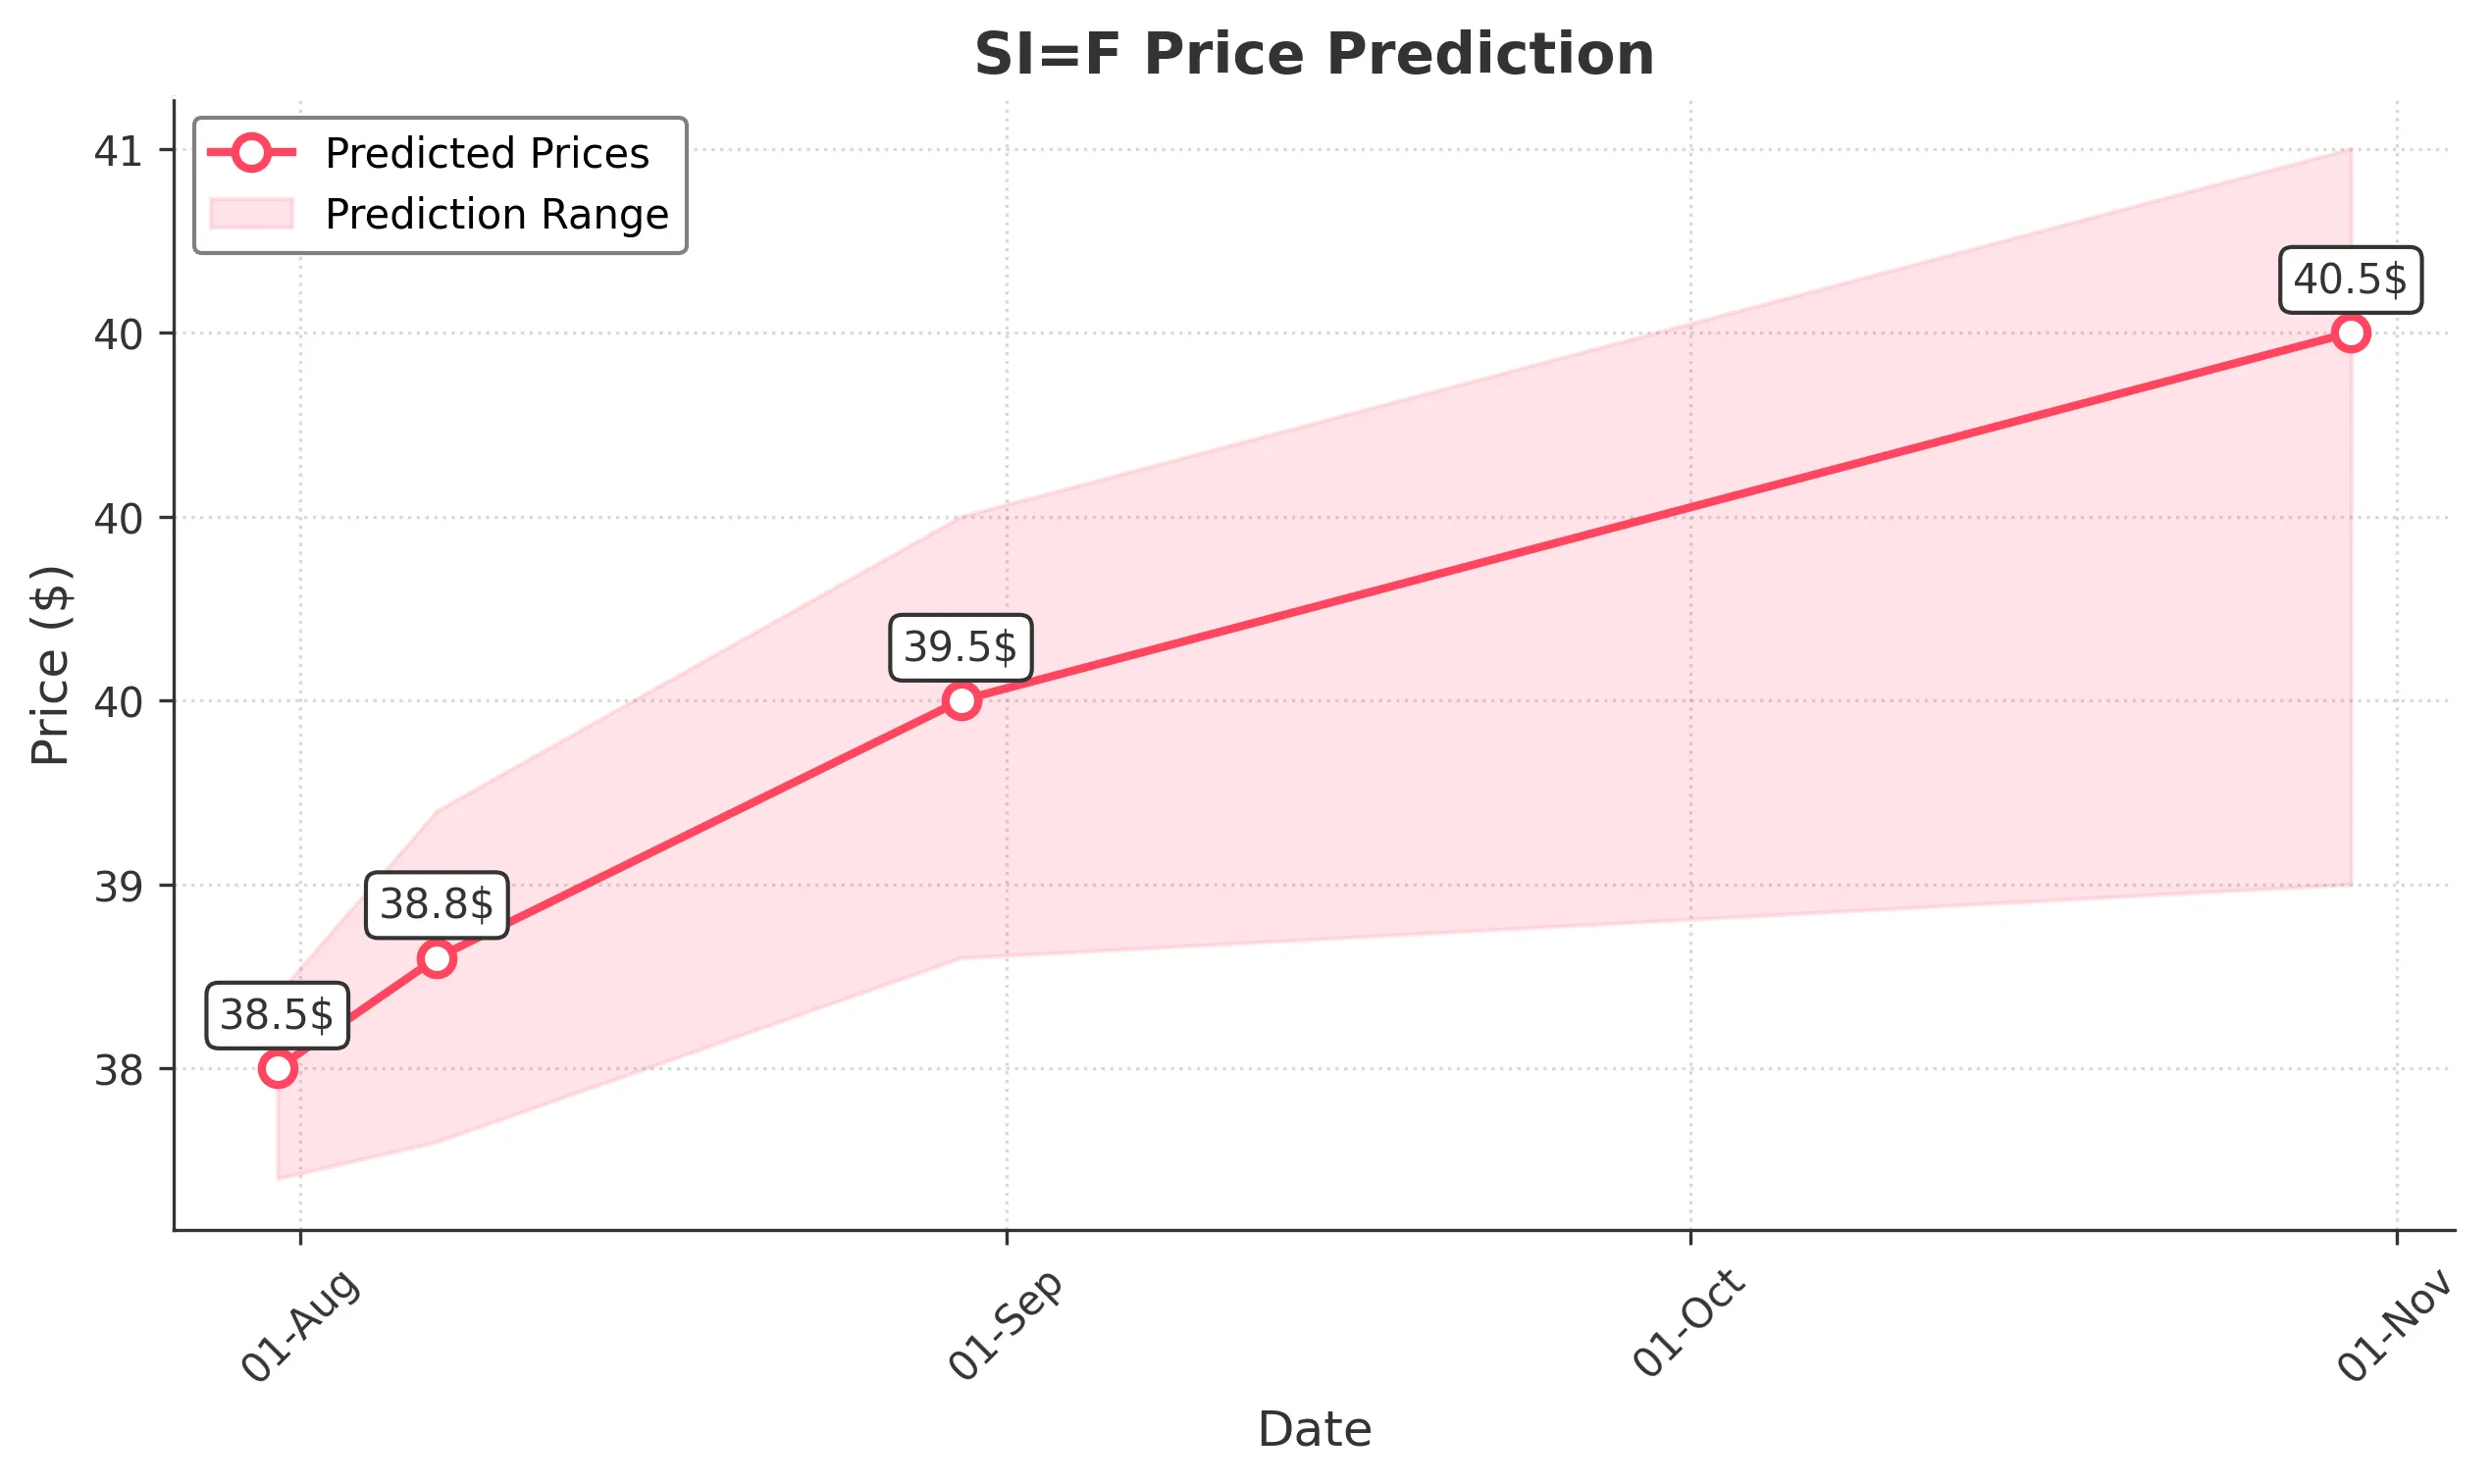
Target: July 31, 2025$38.5
$38.4
$38.7
$38.2
Description
The stock shows a bullish trend with a recent upward movement. The RSI is approaching overbought levels, indicating potential for a pullback. However, strong support at 38.00 and resistance at 39.00 suggest a range-bound movement. Volume is expected to increase slightly.
Analysis
Over the past 3 months, SI=F has shown a bullish trend, with significant support at 38.00 and resistance at 39.00. The MACD indicates upward momentum, while the ATR suggests moderate volatility. Recent volume spikes indicate increased interest, but caution is warranted due to potential overbought conditions.
Confidence Level
Potential Risks
Potential market volatility and external news could impact the price. RSI nearing overbought may lead to a short-term correction.
1 Week Prediction
Target: August 7, 2025$38.8
$38.6
$39.2
$38.3
Description
The stock is expected to continue its upward trajectory, supported by recent bullish candlestick patterns. However, the RSI indicates potential overbought conditions, which may lead to a pullback. Volume is likely to remain steady as traders react to market sentiment.
Analysis
The stock has been in a bullish phase, with key resistance at 39.00. The MACD is positive, indicating upward momentum. However, the RSI is approaching overbought territory, suggesting caution. Volume patterns show increased activity, but external factors could influence price movements.
Confidence Level
Potential Risks
Market sentiment can shift quickly, and any negative news could reverse the trend. Watch for signs of exhaustion in the rally.
1 Month Prediction
Target: August 30, 2025$39.5
$39.2
$40
$38.8
Description
The stock is projected to reach new highs, driven by strong bullish sentiment and positive technical indicators. However, the RSI suggests caution as it approaches overbought levels. A potential pullback could occur if resistance at 40.00 is tested.
Analysis
SI=F has shown a strong upward trend, with significant support at 38.00 and resistance at 40.00. The MACD remains bullish, and volume has been increasing, indicating strong interest. However, the RSI nearing overbought levels suggests a potential correction could occur.
Confidence Level
Potential Risks
Unforeseen macroeconomic events or earnings reports could impact the stock's performance. Watch for signs of reversal.
3 Months Prediction
Target: October 30, 2025$40.5
$40.2
$41
$39
Description
The stock is expected to maintain its bullish trend, potentially reaching new highs. However, the market may experience volatility due to external factors. The RSI indicates overbought conditions, suggesting a possible correction before reaching the target.
Analysis
Over the last three months, SI=F has demonstrated a strong bullish trend, with key support at 38.00 and resistance at 40.00. The MACD is positive, indicating upward momentum, while the ATR suggests moderate volatility. Volume patterns indicate strong interest, but caution is warranted due to potential overbought conditions.
Confidence Level
Potential Risks
Market conditions can change rapidly, and any negative news could lead to a significant pullback. Monitor economic indicators closely.