SIF Trading Predictions
1 Day Prediction
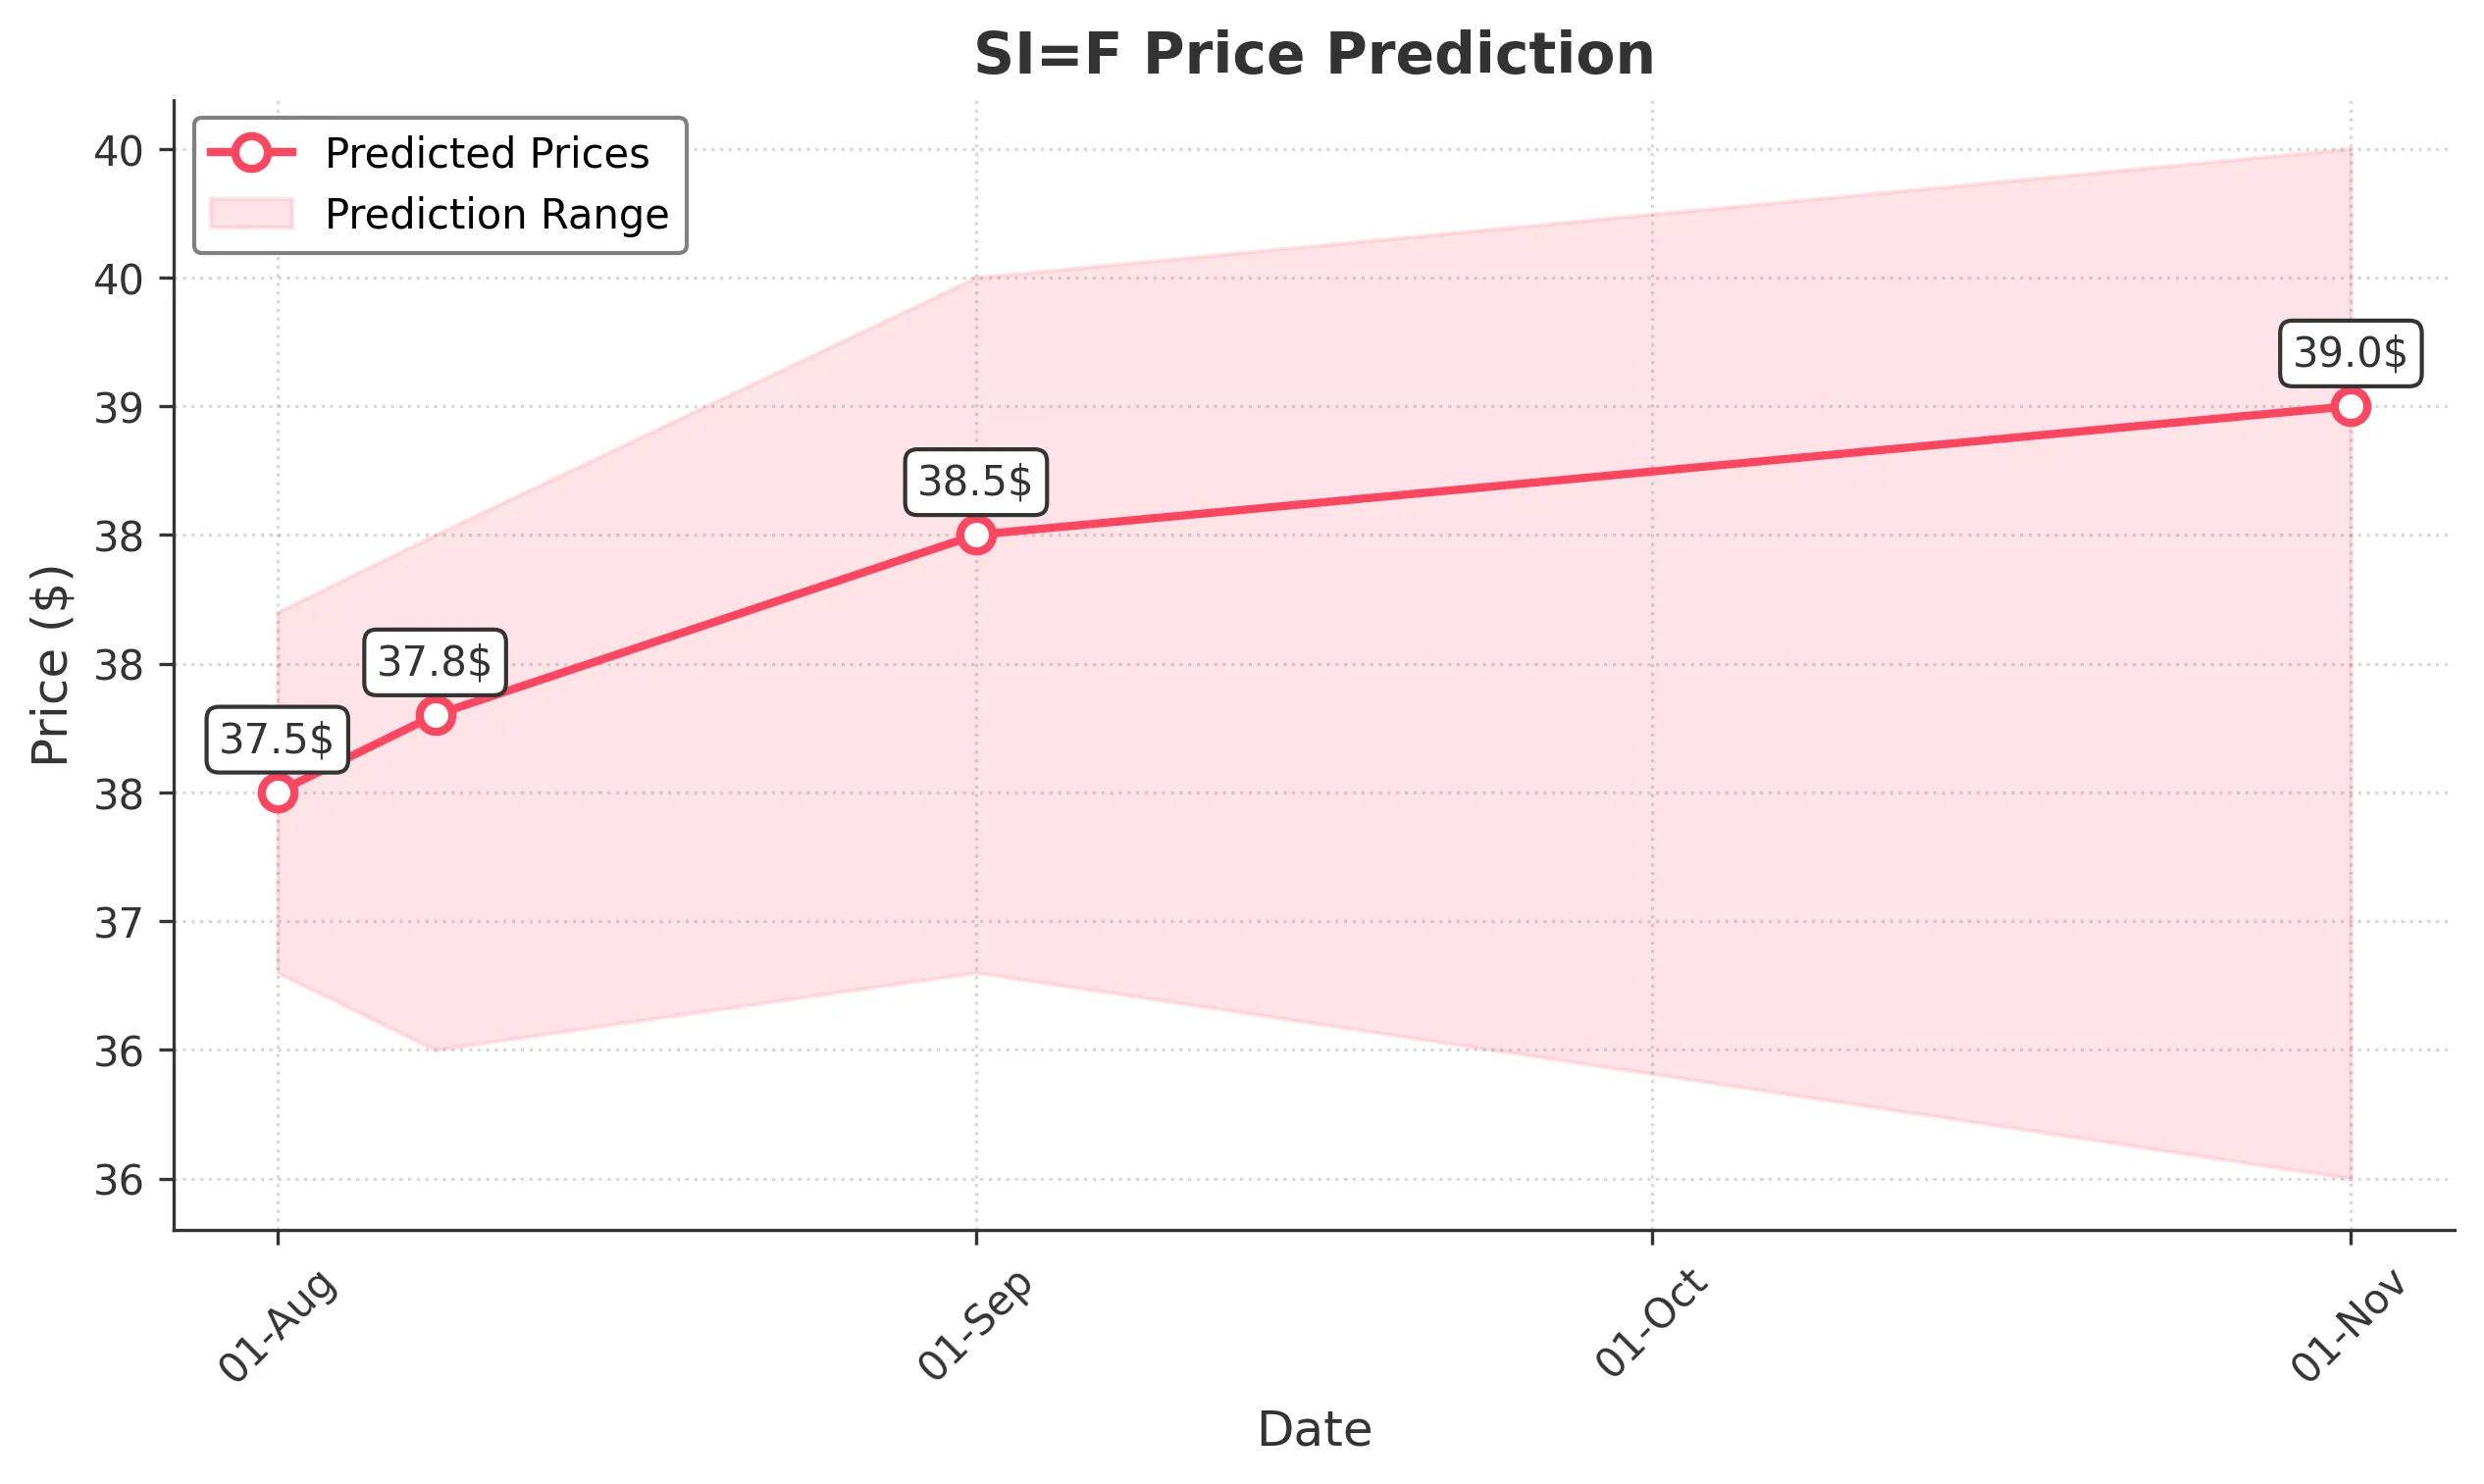
Target: August 1, 2025$37.5
$37.3
$38.2
$36.8
Description
The stock shows a slight bullish trend with a recent Doji pattern indicating indecision. The RSI is near 50, suggesting a potential upward move. However, MACD is flattening, indicating possible resistance ahead.
Analysis
Over the past 3 months, SI=F has shown a bullish trend with significant support at 36.00 and resistance around 39.00. The recent price action indicates consolidation, with volume spikes suggesting increased interest. Technical indicators like the MACD and RSI show mixed signals, indicating potential for both upward and downward movements.
Confidence Level
Potential Risks
Market volatility and external news could impact the price. A bearish reversal is possible if the price fails to break above recent highs.
1 Week Prediction
Target: August 8, 2025$37.8
$37.6
$38.5
$36.5
Description
The stock is expected to continue its upward momentum, supported by a bullish engulfing pattern. The MACD is showing a bullish crossover, and the RSI is moving towards overbought territory, indicating strong buying interest.
Analysis
The stock has been in a bullish phase, with key support at 36.00 and resistance at 39.00. The recent price action shows a strong upward trend, with increasing volume on up days. Technical indicators support further gains, but caution is warranted due to potential overbought conditions.
Confidence Level
Potential Risks
Potential market corrections or negative news could lead to a pullback. Watch for volume trends to confirm the bullish sentiment.
1 Month Prediction
Target: September 1, 2025$38.5
$37.9
$39.5
$36.8
Description
The stock is likely to reach higher levels as bullish momentum continues. The Fibonacci retracement levels suggest a target around 38.50, with strong support at 36.80. However, the RSI indicates potential overbought conditions.
Analysis
SI=F has shown a strong bullish trend over the past three months, with significant resistance at 39.00. The stock's performance has been supported by increasing volume and positive technical indicators. However, the market remains sensitive to external factors that could lead to volatility.
Confidence Level
Potential Risks
Market sentiment can shift quickly, and any negative macroeconomic news could impact the stock's performance. Watch for signs of reversal.
3 Months Prediction
Target: November 1, 2025$39
$38.5
$40
$36
Description
The stock is expected to test the 40.00 resistance level, driven by bullish sentiment and strong fundamentals. However, the MACD shows signs of divergence, indicating potential weakness ahead.
Analysis
The overall trend for SI=F has been bullish, with key support at 36.00 and resistance at 40.00. The stock has shown resilience, but technical indicators suggest caution as it approaches overbought levels. External economic factors and market sentiment will play a crucial role in future performance.
Confidence Level
Potential Risks
Long-term predictions are subject to greater uncertainty due to market fluctuations and economic conditions. A bearish trend could emerge if the stock fails to maintain momentum.