SIF Trading Predictions
1 Day Prediction
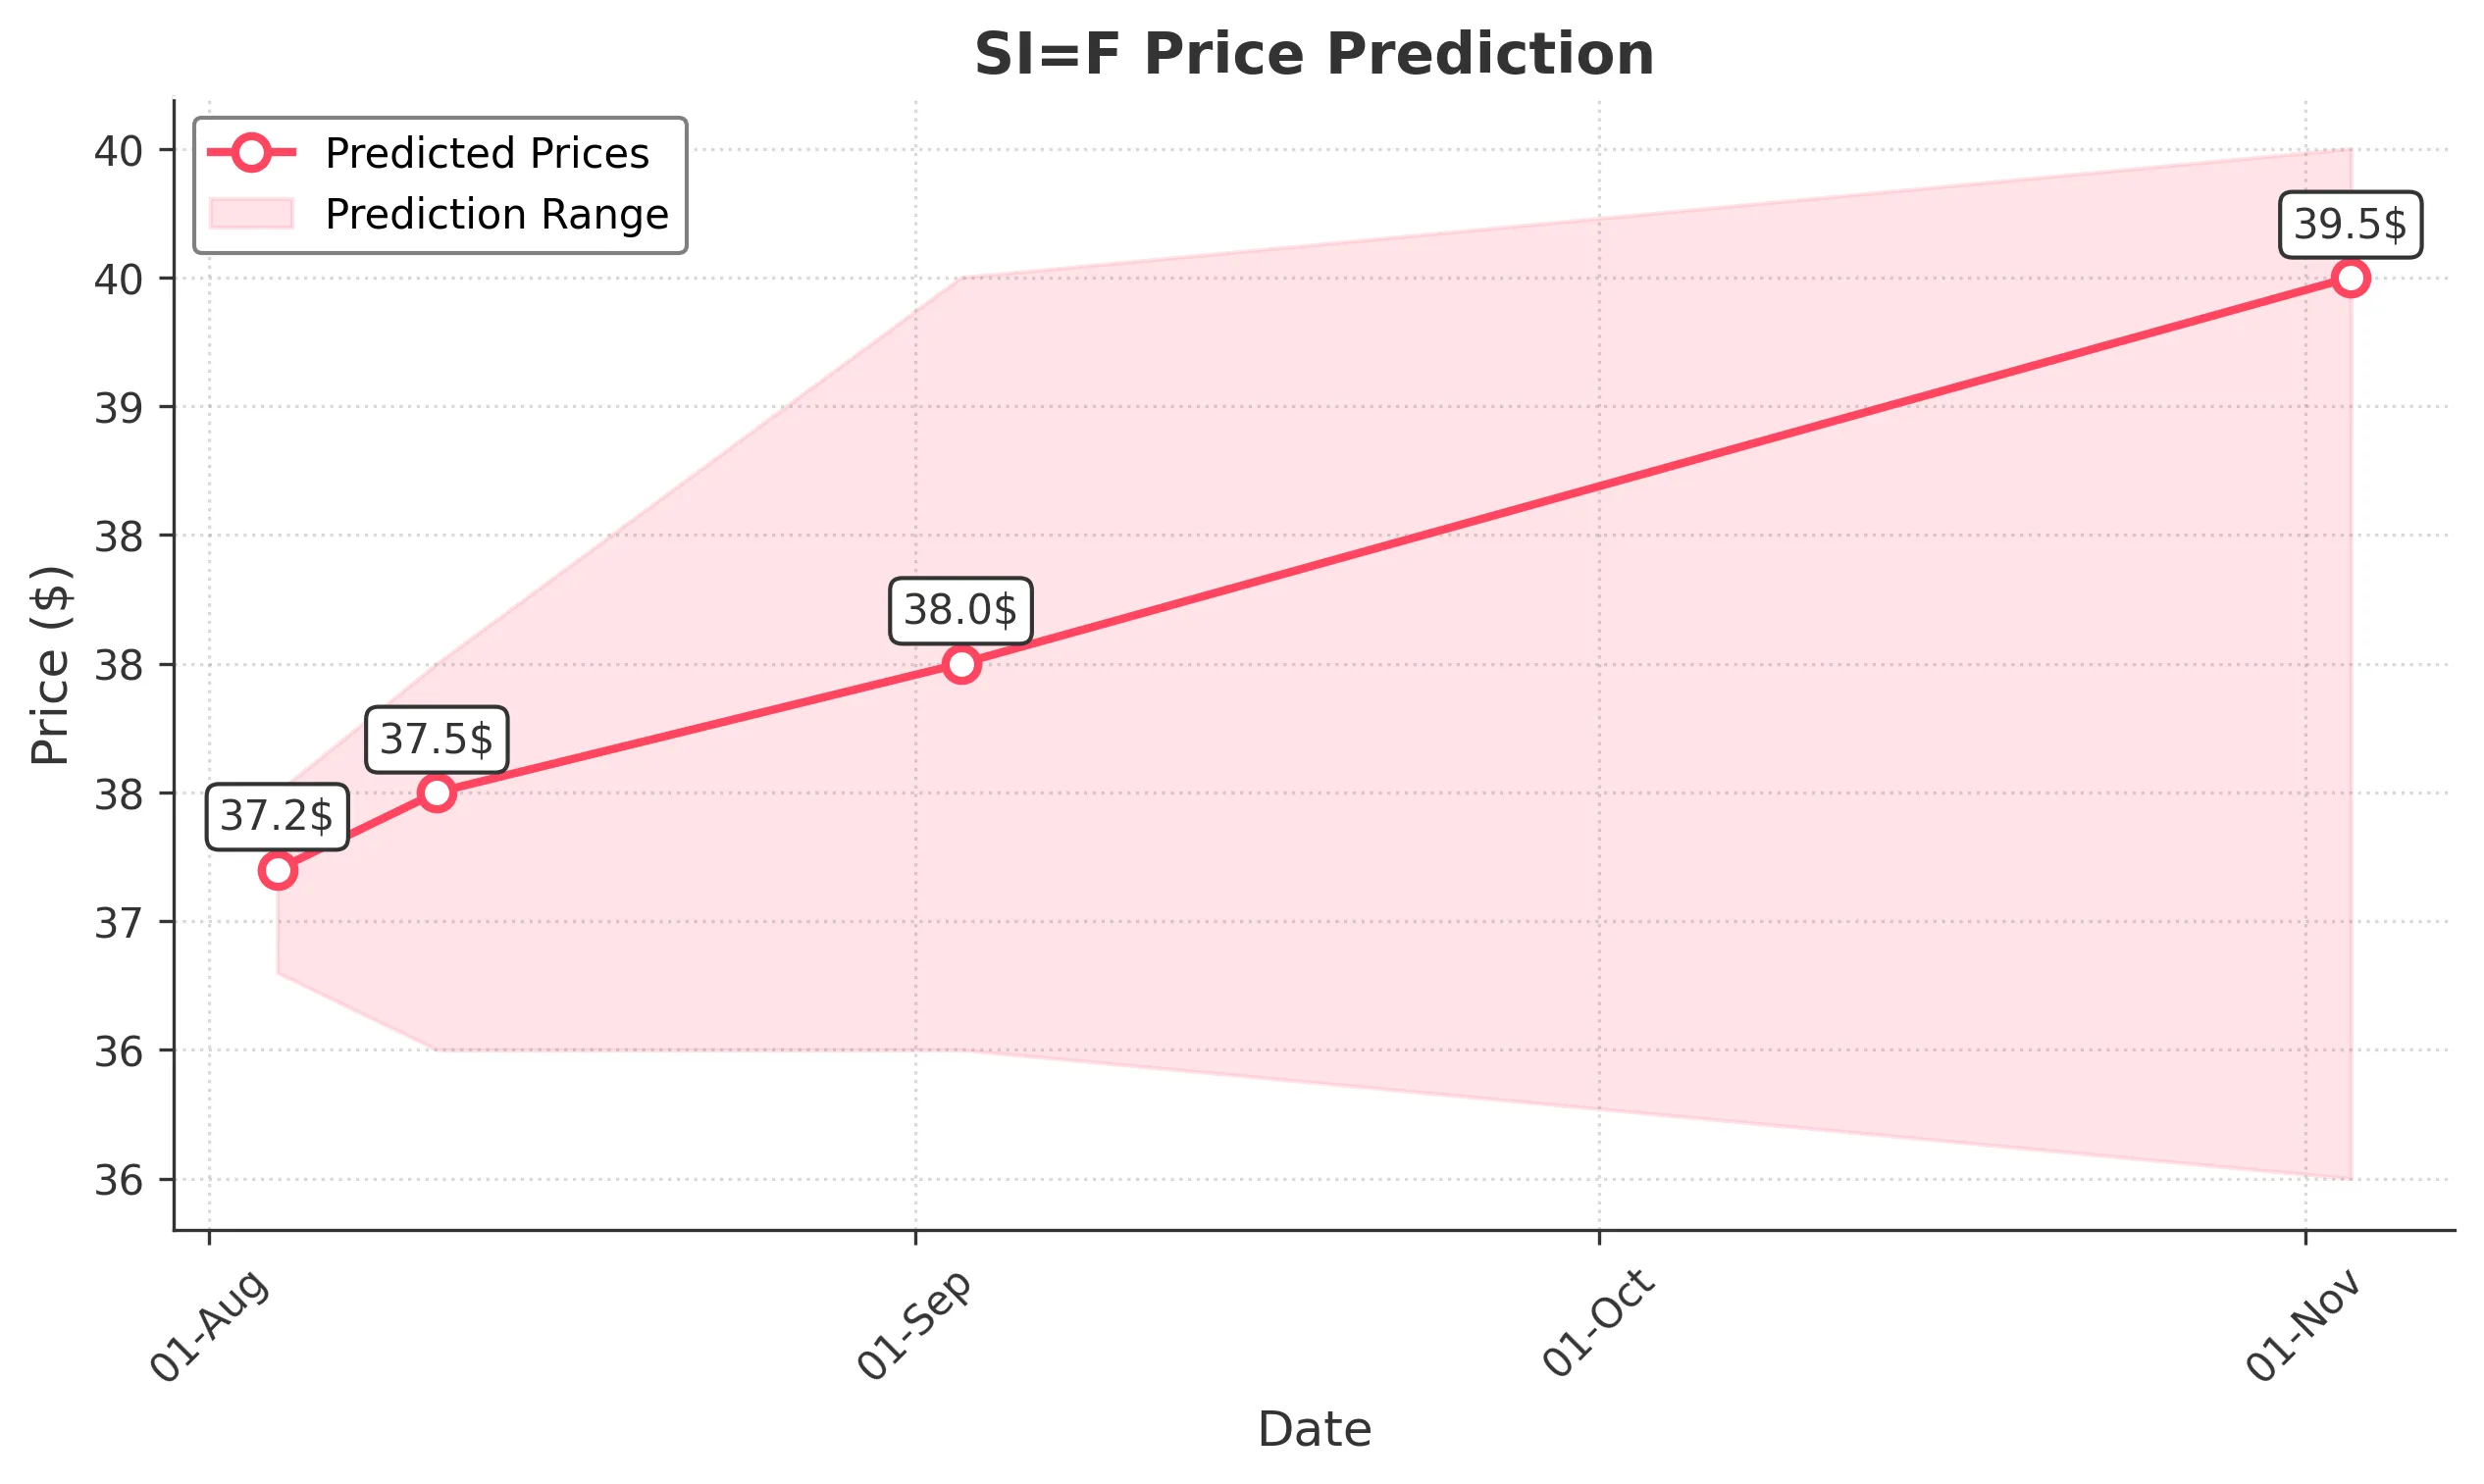
Target: August 4, 2025$37.2
$37
$37.5
$36.8
Description
The stock shows a bullish trend with a recent upward movement. The RSI is approaching overbought levels, indicating potential for a pullback. However, the MACD remains positive, suggesting continued momentum. Volume is expected to be moderate.
Analysis
Over the past 3 months, SI=F has shown a bullish trend, with significant support at 36.00 and resistance around 39.00. The recent price action indicates a strong upward momentum, but the RSI suggests caution as it nears overbought territory.
Confidence Level
Potential Risks
Potential market volatility and profit-taking could lead to a price drop.
1 Week Prediction
Target: August 11, 2025$37.5
$37.2
$38
$36.5
Description
The stock is expected to maintain its upward trajectory, supported by bullish sentiment and positive MACD. However, the RSI indicates potential overbought conditions, which may lead to short-term corrections.
Analysis
The stock has been trending upward, with key resistance at 39.00. The volume has been increasing, indicating strong interest. However, the RSI nearing overbought levels suggests caution for potential pullbacks.
Confidence Level
Potential Risks
Market corrections or negative news could impact the price.
1 Month Prediction
Target: September 3, 2025$38
$37.8
$39.5
$36.5
Description
The stock is likely to continue its bullish trend, with strong support at 36.00. The MACD remains positive, but the RSI indicates potential overbought conditions, suggesting a possible correction before reaching higher levels.
Analysis
SI=F has shown a consistent upward trend, with significant resistance at 39.00. The volume patterns indicate strong buying interest, but the RSI suggests caution as it approaches overbought territory.
Confidence Level
Potential Risks
External market factors or economic data releases could affect the stock's performance.
3 Months Prediction
Target: November 3, 2025$39.5
$38.5
$40
$36
Description
The stock is expected to reach new highs, driven by bullish sentiment and strong technical indicators. However, the potential for market corrections remains, especially if the RSI continues to indicate overbought conditions.
Analysis
The overall trend for SI=F is bullish, with key support at 36.00 and resistance at 40.00. The MACD and volume patterns support upward movement, but the RSI indicates caution as it approaches overbought levels.
Confidence Level
Potential Risks
Market volatility and economic uncertainties could lead to unexpected price movements.