SIF Trading Predictions
1 Day Prediction
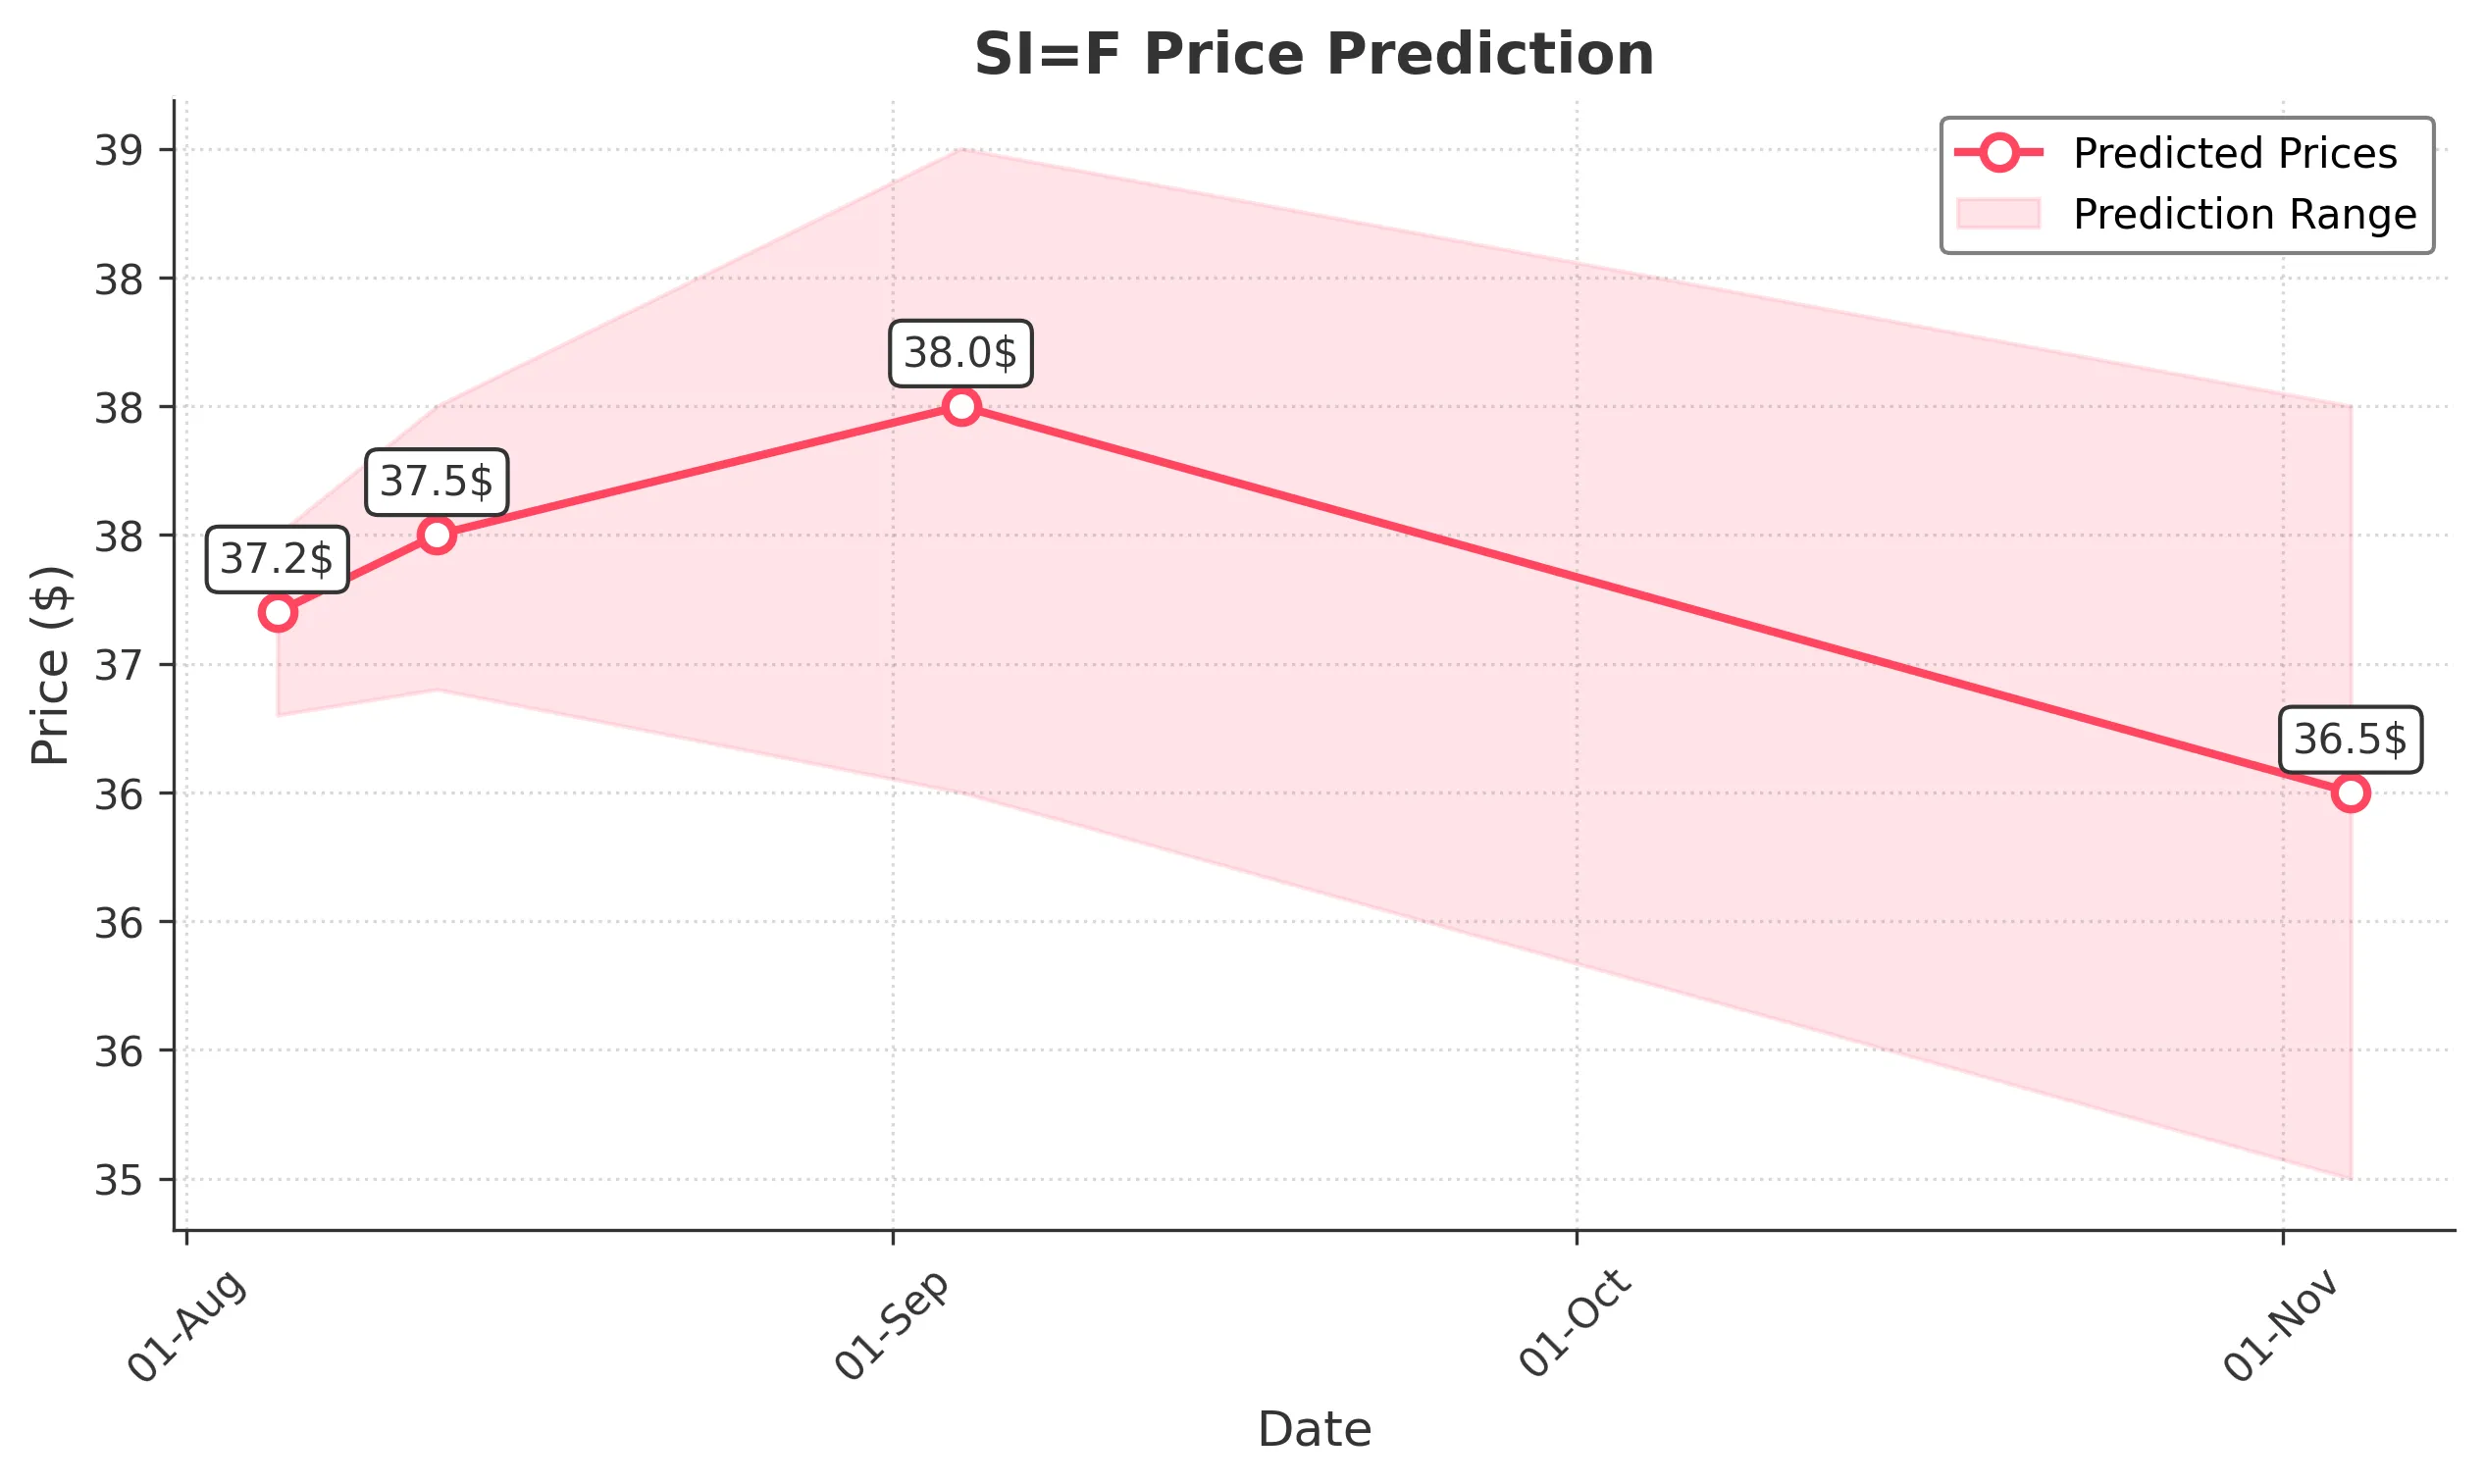
Target: August 5, 2025$37.2
$37.1
$37.5
$36.8
Description
The stock shows a bullish trend with a recent upward movement. The RSI is approaching overbought levels, indicating potential for a pullback. However, the MACD is positive, suggesting continued momentum. Volume is expected to increase as traders react to recent highs.
Analysis
Over the past 3 months, SI=F has shown a bullish trend, with significant support at 36.00 and resistance around 39.00. The MACD indicates upward momentum, while the RSI is nearing overbought territory. Recent volume spikes suggest increased interest, but caution is warranted due to potential reversals.
Confidence Level
Potential Risks
Potential for a pullback due to overbought RSI conditions. Market sentiment may shift based on external news.
1 Week Prediction
Target: August 12, 2025$37.5
$37.2
$38
$36.9
Description
The stock is expected to maintain its upward trajectory, supported by strong recent performance. The Bollinger Bands indicate potential for a breakout. However, the RSI suggests caution as it approaches overbought levels.
Analysis
The stock has been in a bullish phase, with key support at 36.00 and resistance at 39.00. The MACD remains positive, and volume trends indicate strong buying interest. However, the RSI nearing overbought levels raises concerns about potential pullbacks.
Confidence Level
Potential Risks
Market volatility and external economic factors could impact performance. Watch for any bearish reversal patterns.
1 Month Prediction
Target: September 4, 2025$38
$37.8
$39
$36.5
Description
The stock is likely to continue its upward trend, but with increasing volatility. The Fibonacci retracement levels suggest a target around 38.50. Watch for potential resistance at 39.00.
Analysis
SI=F has shown a strong bullish trend, with significant support at 36.00 and resistance at 39.00. The MACD is positive, but the RSI indicates potential overbought conditions. Volume patterns suggest strong interest, but caution is advised due to potential market shifts.
Confidence Level
Potential Risks
External market conditions and economic data releases could lead to unexpected volatility. Watch for bearish signals.
3 Months Prediction
Target: November 4, 2025$36.5
$36.8
$38
$35
Description
Expect a potential correction as the stock may face resistance at higher levels. The MACD may turn bearish, and the RSI could indicate overbought conditions leading to a pullback.
Analysis
The stock has been bullish, but signs of potential exhaustion are emerging. Key support is at 35.00, with resistance at 39.00. The MACD may indicate a shift in momentum, and the RSI suggests caution. Volume patterns show interest, but external factors could lead to volatility.
Confidence Level
Potential Risks
Market sentiment can shift rapidly due to economic data or geopolitical events. Watch for signs of reversal.