SIF Trading Predictions
1 Day Prediction
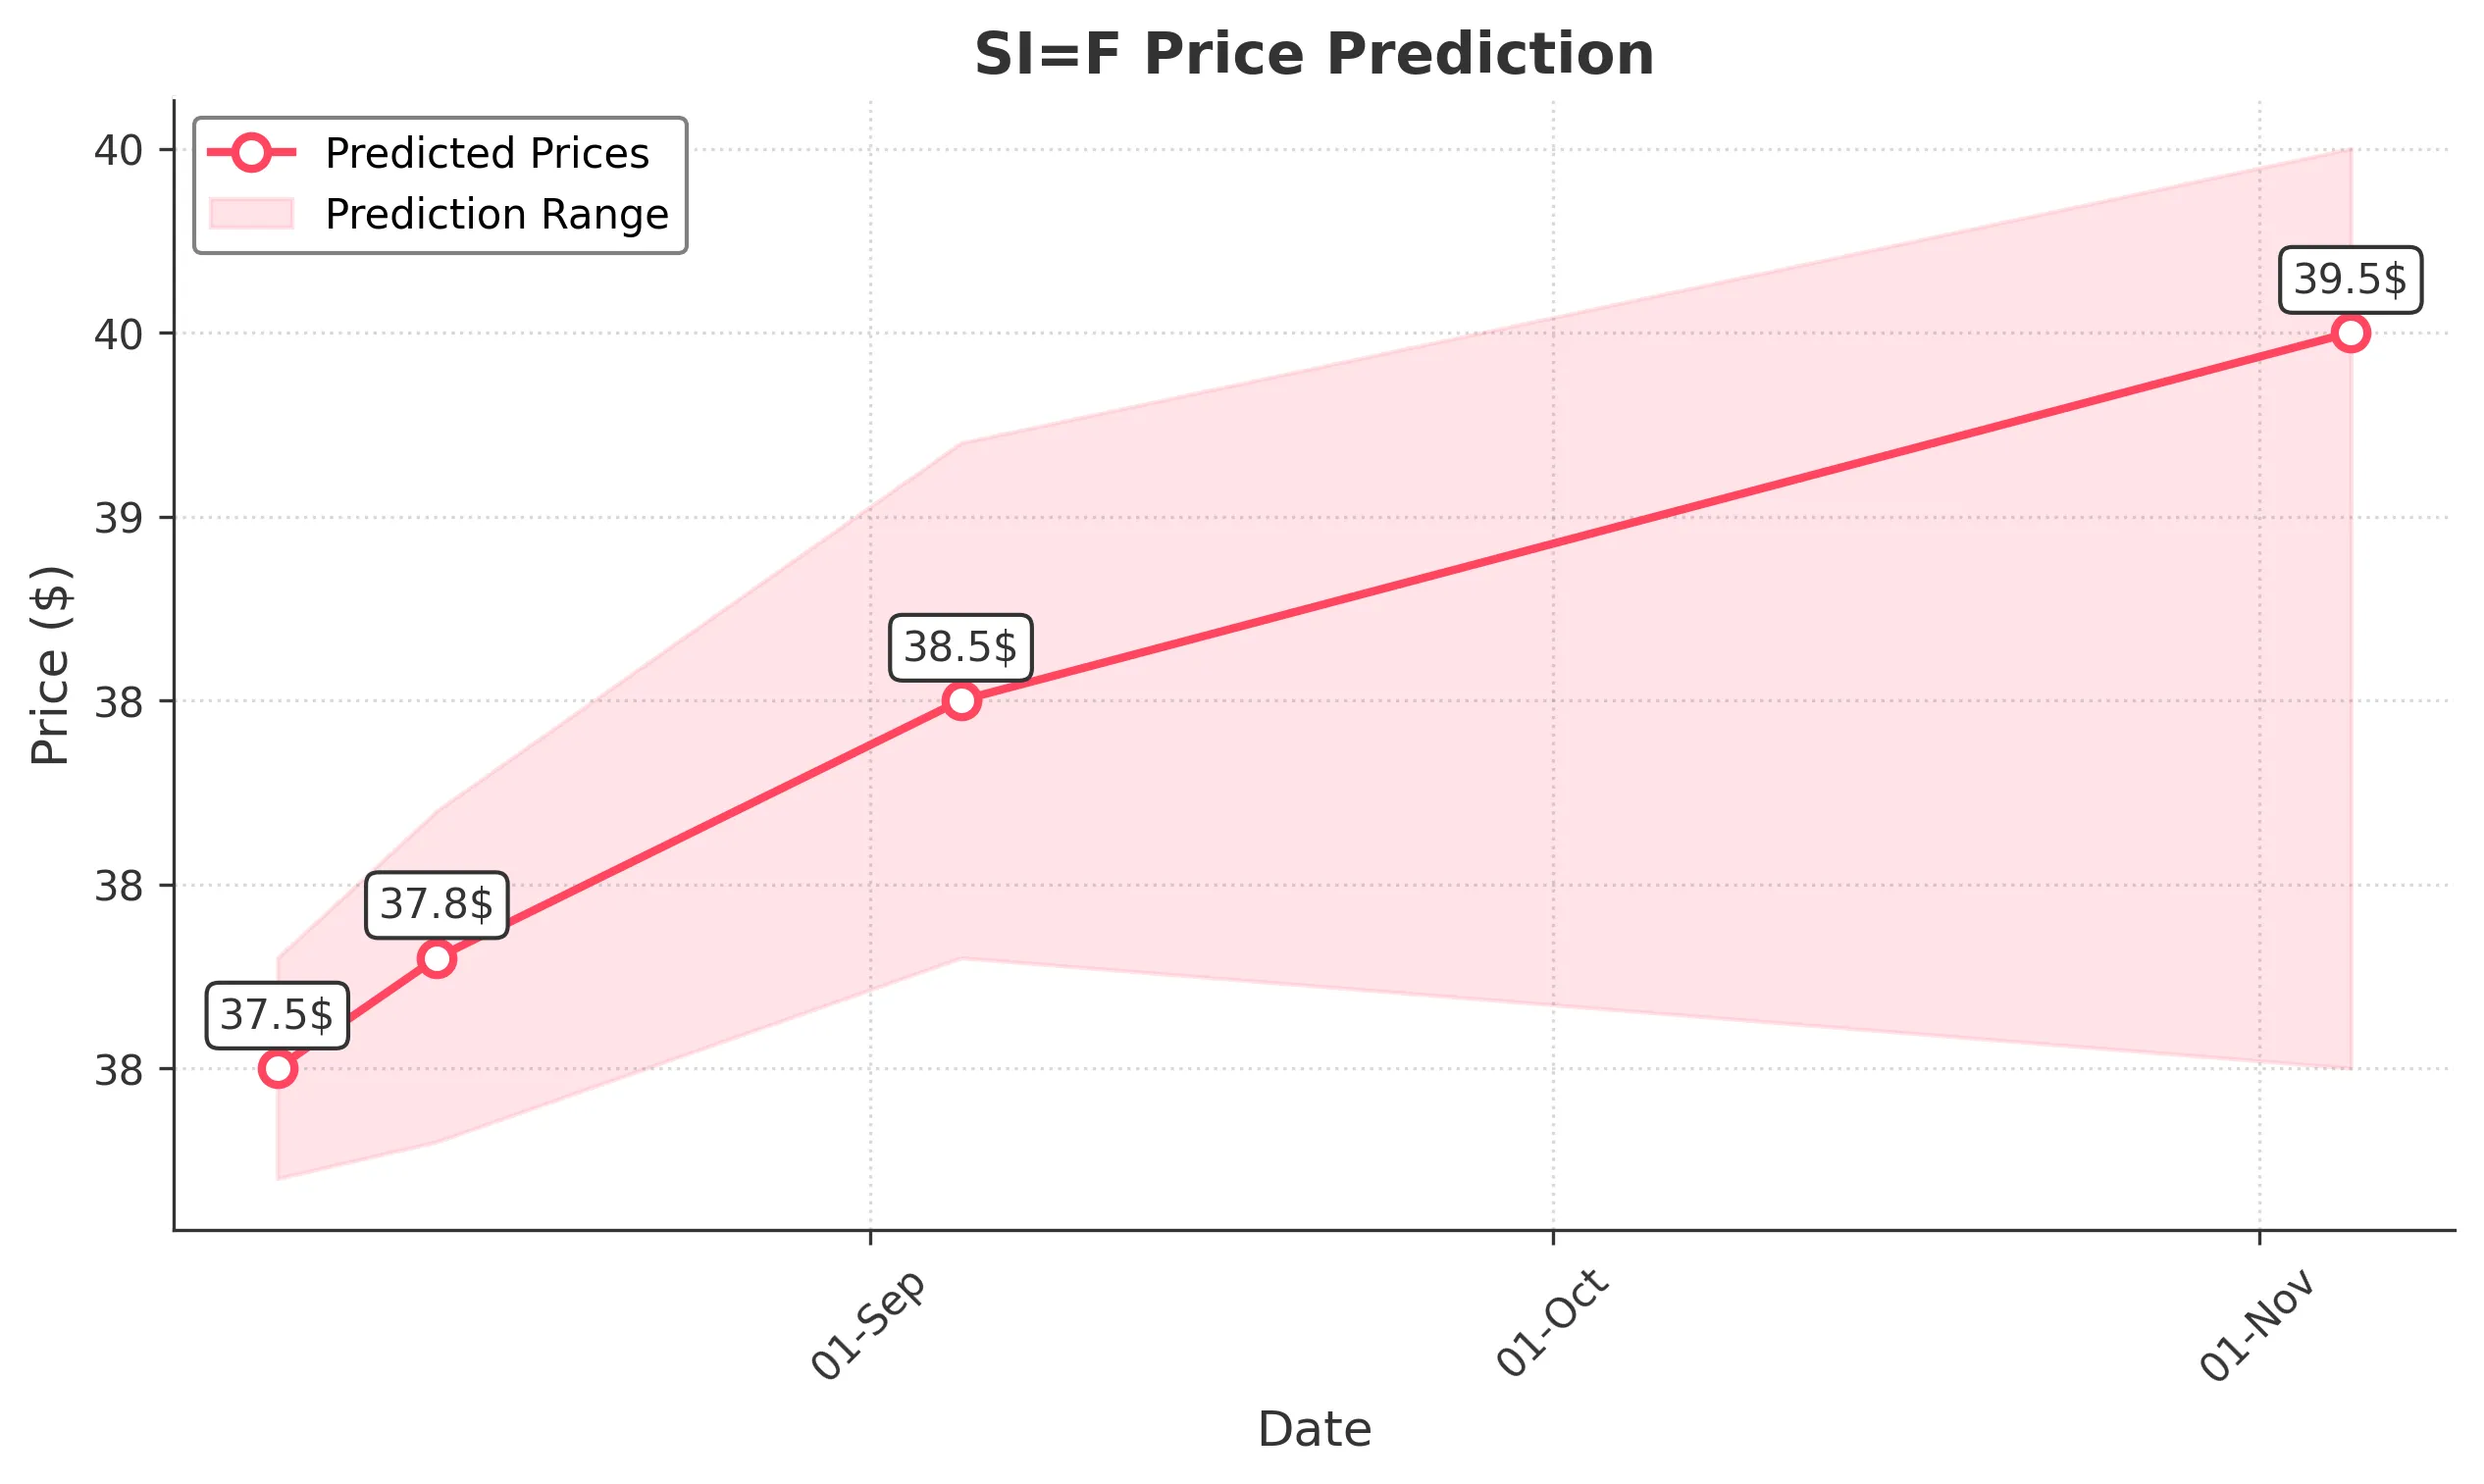
Target: August 6, 2025$37.5
$37.4
$37.8
$37.2
Description
The stock shows a bullish trend with a recent upward movement. The RSI is approaching overbought levels, indicating potential for a pullback. However, the MACD is positive, suggesting continued momentum. Volume has been increasing, supporting the upward trend.
Analysis
Over the past 3 months, SI=F has shown a bullish trend, with significant support at 36.00 and resistance around 39.00. The recent price action indicates strong buying interest, but the RSI nearing overbought levels suggests caution. Volume patterns indicate increased interest, but external market factors could introduce volatility.
Confidence Level
Potential Risks
Potential market volatility and profit-taking could lead to a reversal.
1 Week Prediction
Target: August 13, 2025$37.8
$37.6
$38.2
$37.3
Description
The stock is expected to maintain its upward trajectory, supported by bullish sentiment and positive technical indicators. The MACD remains above the signal line, and the price is above the 20-day moving average, indicating strength. However, watch for potential resistance at 38.00.
Analysis
The stock has been in a bullish phase, with key support at 36.00 and resistance at 39.00. The recent price action shows strong buying pressure, but the RSI indicates potential overbought conditions. Volume has been consistent, suggesting sustained interest, but external factors could introduce risk.
Confidence Level
Potential Risks
Market sentiment can shift quickly, and any negative news could impact the stock's performance.
1 Month Prediction
Target: September 5, 2025$38.5
$37.9
$39.2
$37.8
Description
The stock is likely to continue its upward trend, driven by strong fundamentals and positive market sentiment. The MACD remains bullish, and the price is expected to test the resistance level at 39.00. However, watch for any signs of exhaustion in the rally.
Analysis
SI=F has shown a strong bullish trend over the past three months, with significant support at 36.00 and resistance at 39.00. The technical indicators suggest continued strength, but the RSI indicates potential overbought conditions. Volume patterns are supportive, but external market conditions could introduce volatility.
Confidence Level
Potential Risks
Potential market corrections and external economic factors could impact the stock's trajectory.
3 Months Prediction
Target: November 5, 2025$39.5
$38.8
$40
$37.5
Description
The stock is expected to reach new highs, supported by strong fundamentals and positive market sentiment. The MACD and moving averages indicate bullish momentum. However, potential resistance at 40.00 could lead to profit-taking.
Analysis
Over the past three months, SI=F has demonstrated a bullish trend with key support at 36.00 and resistance at 39.00. The technical indicators suggest continued upward momentum, but the RSI indicates potential overbought conditions. Volume patterns show increasing interest, but external factors could introduce risks.
Confidence Level
Potential Risks
Market corrections and economic uncertainties could lead to volatility and impact the stock's performance.