SIF Trading Predictions
1 Day Prediction
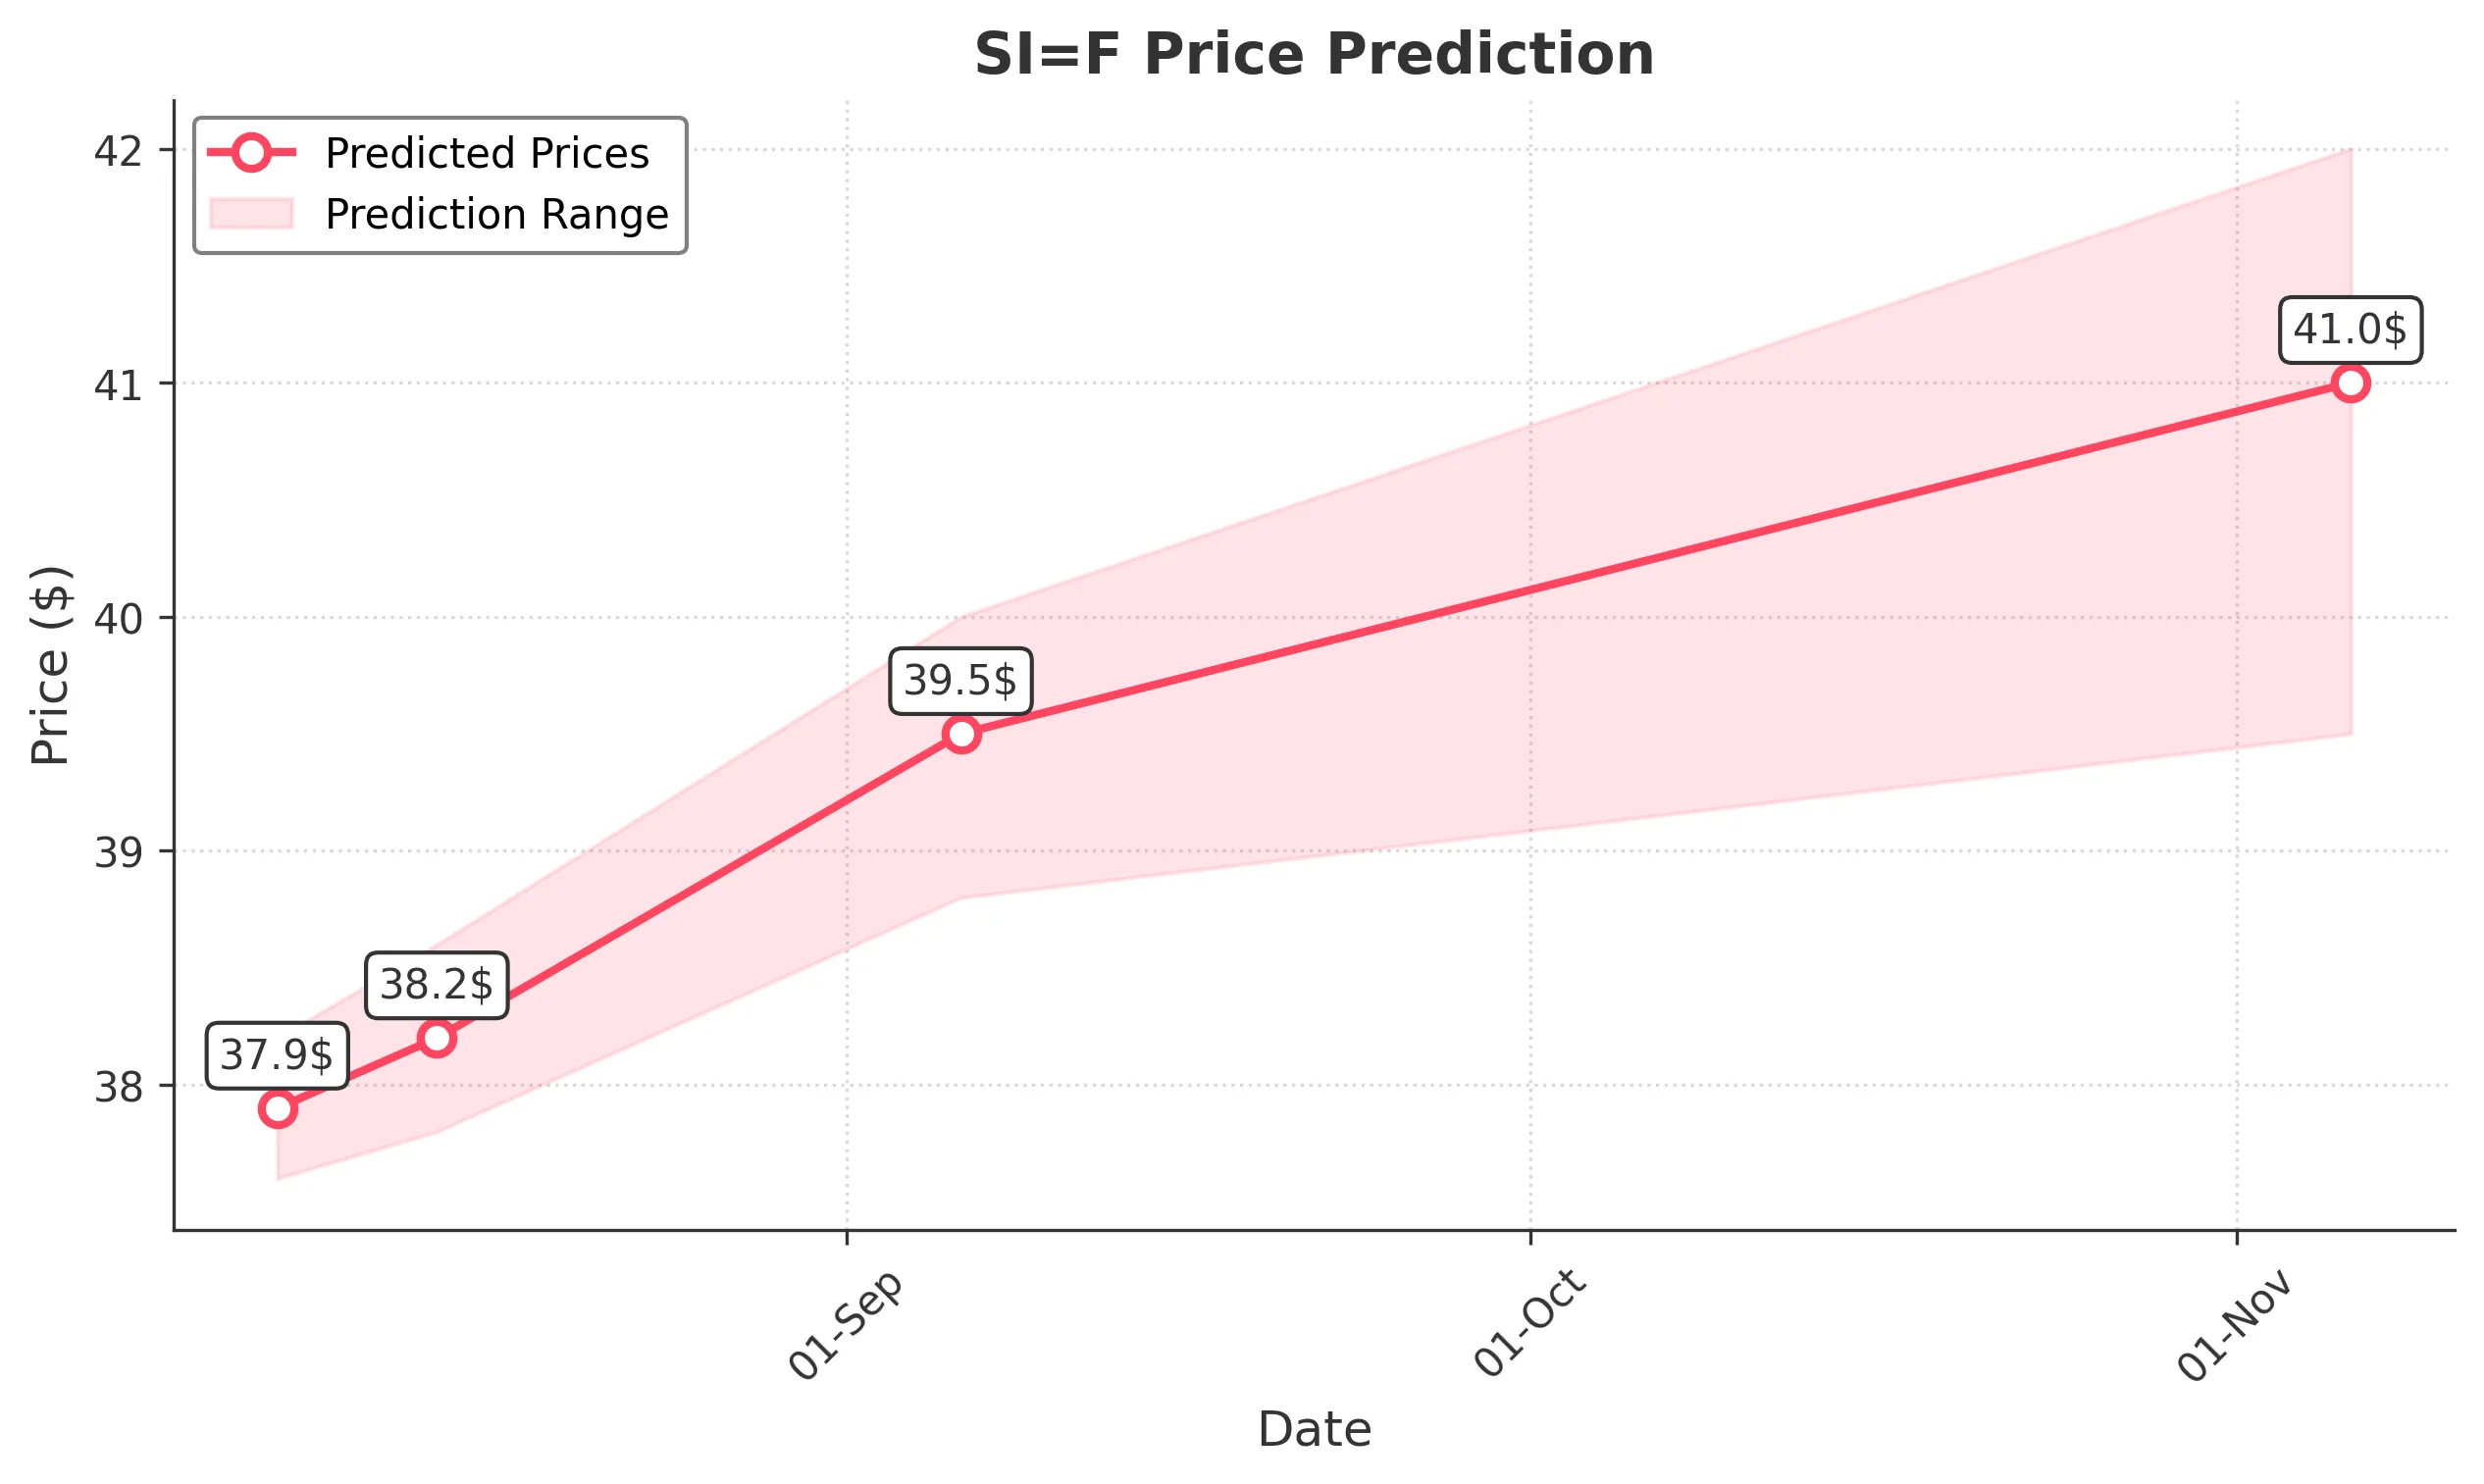
Target: August 7, 2025$37.9
$37.8
$38.2
$37.6
Description
The stock shows a bullish trend with a recent upward movement. The RSI is approaching overbought levels, indicating potential for a pullback. However, the MACD remains positive, suggesting continued momentum. Volume has been increasing, supporting the price rise.
Analysis
Over the past 3 months, SI=F has shown a bullish trend, with significant support at $36.00 and resistance around $39.00. The recent price action indicates strong buying interest, but the RSI suggests caution as it nears overbought territory.
Confidence Level
Potential Risks
Potential market volatility and profit-taking could lead to a price correction.
1 Week Prediction
Target: August 14, 2025$38.2
$37.9
$38.6
$37.8
Description
The stock is expected to maintain its upward trajectory, supported by strong bullish momentum. The MACD remains positive, and the recent candlestick patterns indicate continued buying pressure. However, watch for potential resistance at $39.00.
Analysis
The stock has been trending upward, with key support at $36.00. The recent price action shows strong buying interest, but the RSI indicates potential overbought conditions. Volume patterns suggest sustained interest, but caution is warranted.
Confidence Level
Potential Risks
Market sentiment could shift due to external factors, impacting the bullish outlook.
1 Month Prediction
Target: September 6, 2025$39.5
$38.9
$40
$38.8
Description
The stock is likely to reach new highs as bullish momentum continues. The MACD and moving averages support this trend, but the RSI indicates potential overbought conditions. A pullback could occur if resistance at $40.00 is tested.
Analysis
SI=F has shown a strong bullish trend with significant resistance at $40.00. The stock's performance has been supported by increasing volume and positive technical indicators, but caution is advised as the RSI approaches overbought levels.
Confidence Level
Potential Risks
External market conditions and economic data releases could impact the stock's performance.
3 Months Prediction
Target: November 6, 2025$41
$40
$42
$39.5
Description
The stock is expected to continue its upward trend, potentially reaching $41.00. However, the RSI indicates overbought conditions, suggesting a possible correction. Market sentiment and macroeconomic factors will play a crucial role.
Analysis
Over the past three months, SI=F has shown a strong bullish trend, with key support at $36.00 and resistance at $40.00. The stock's performance has been characterized by increasing volume and positive technical indicators, but caution is warranted due to potential overbought conditions.
Confidence Level
Potential Risks
Unforeseen economic events or shifts in market sentiment could lead to volatility and price corrections.