SIF Trading Predictions
1 Day Prediction
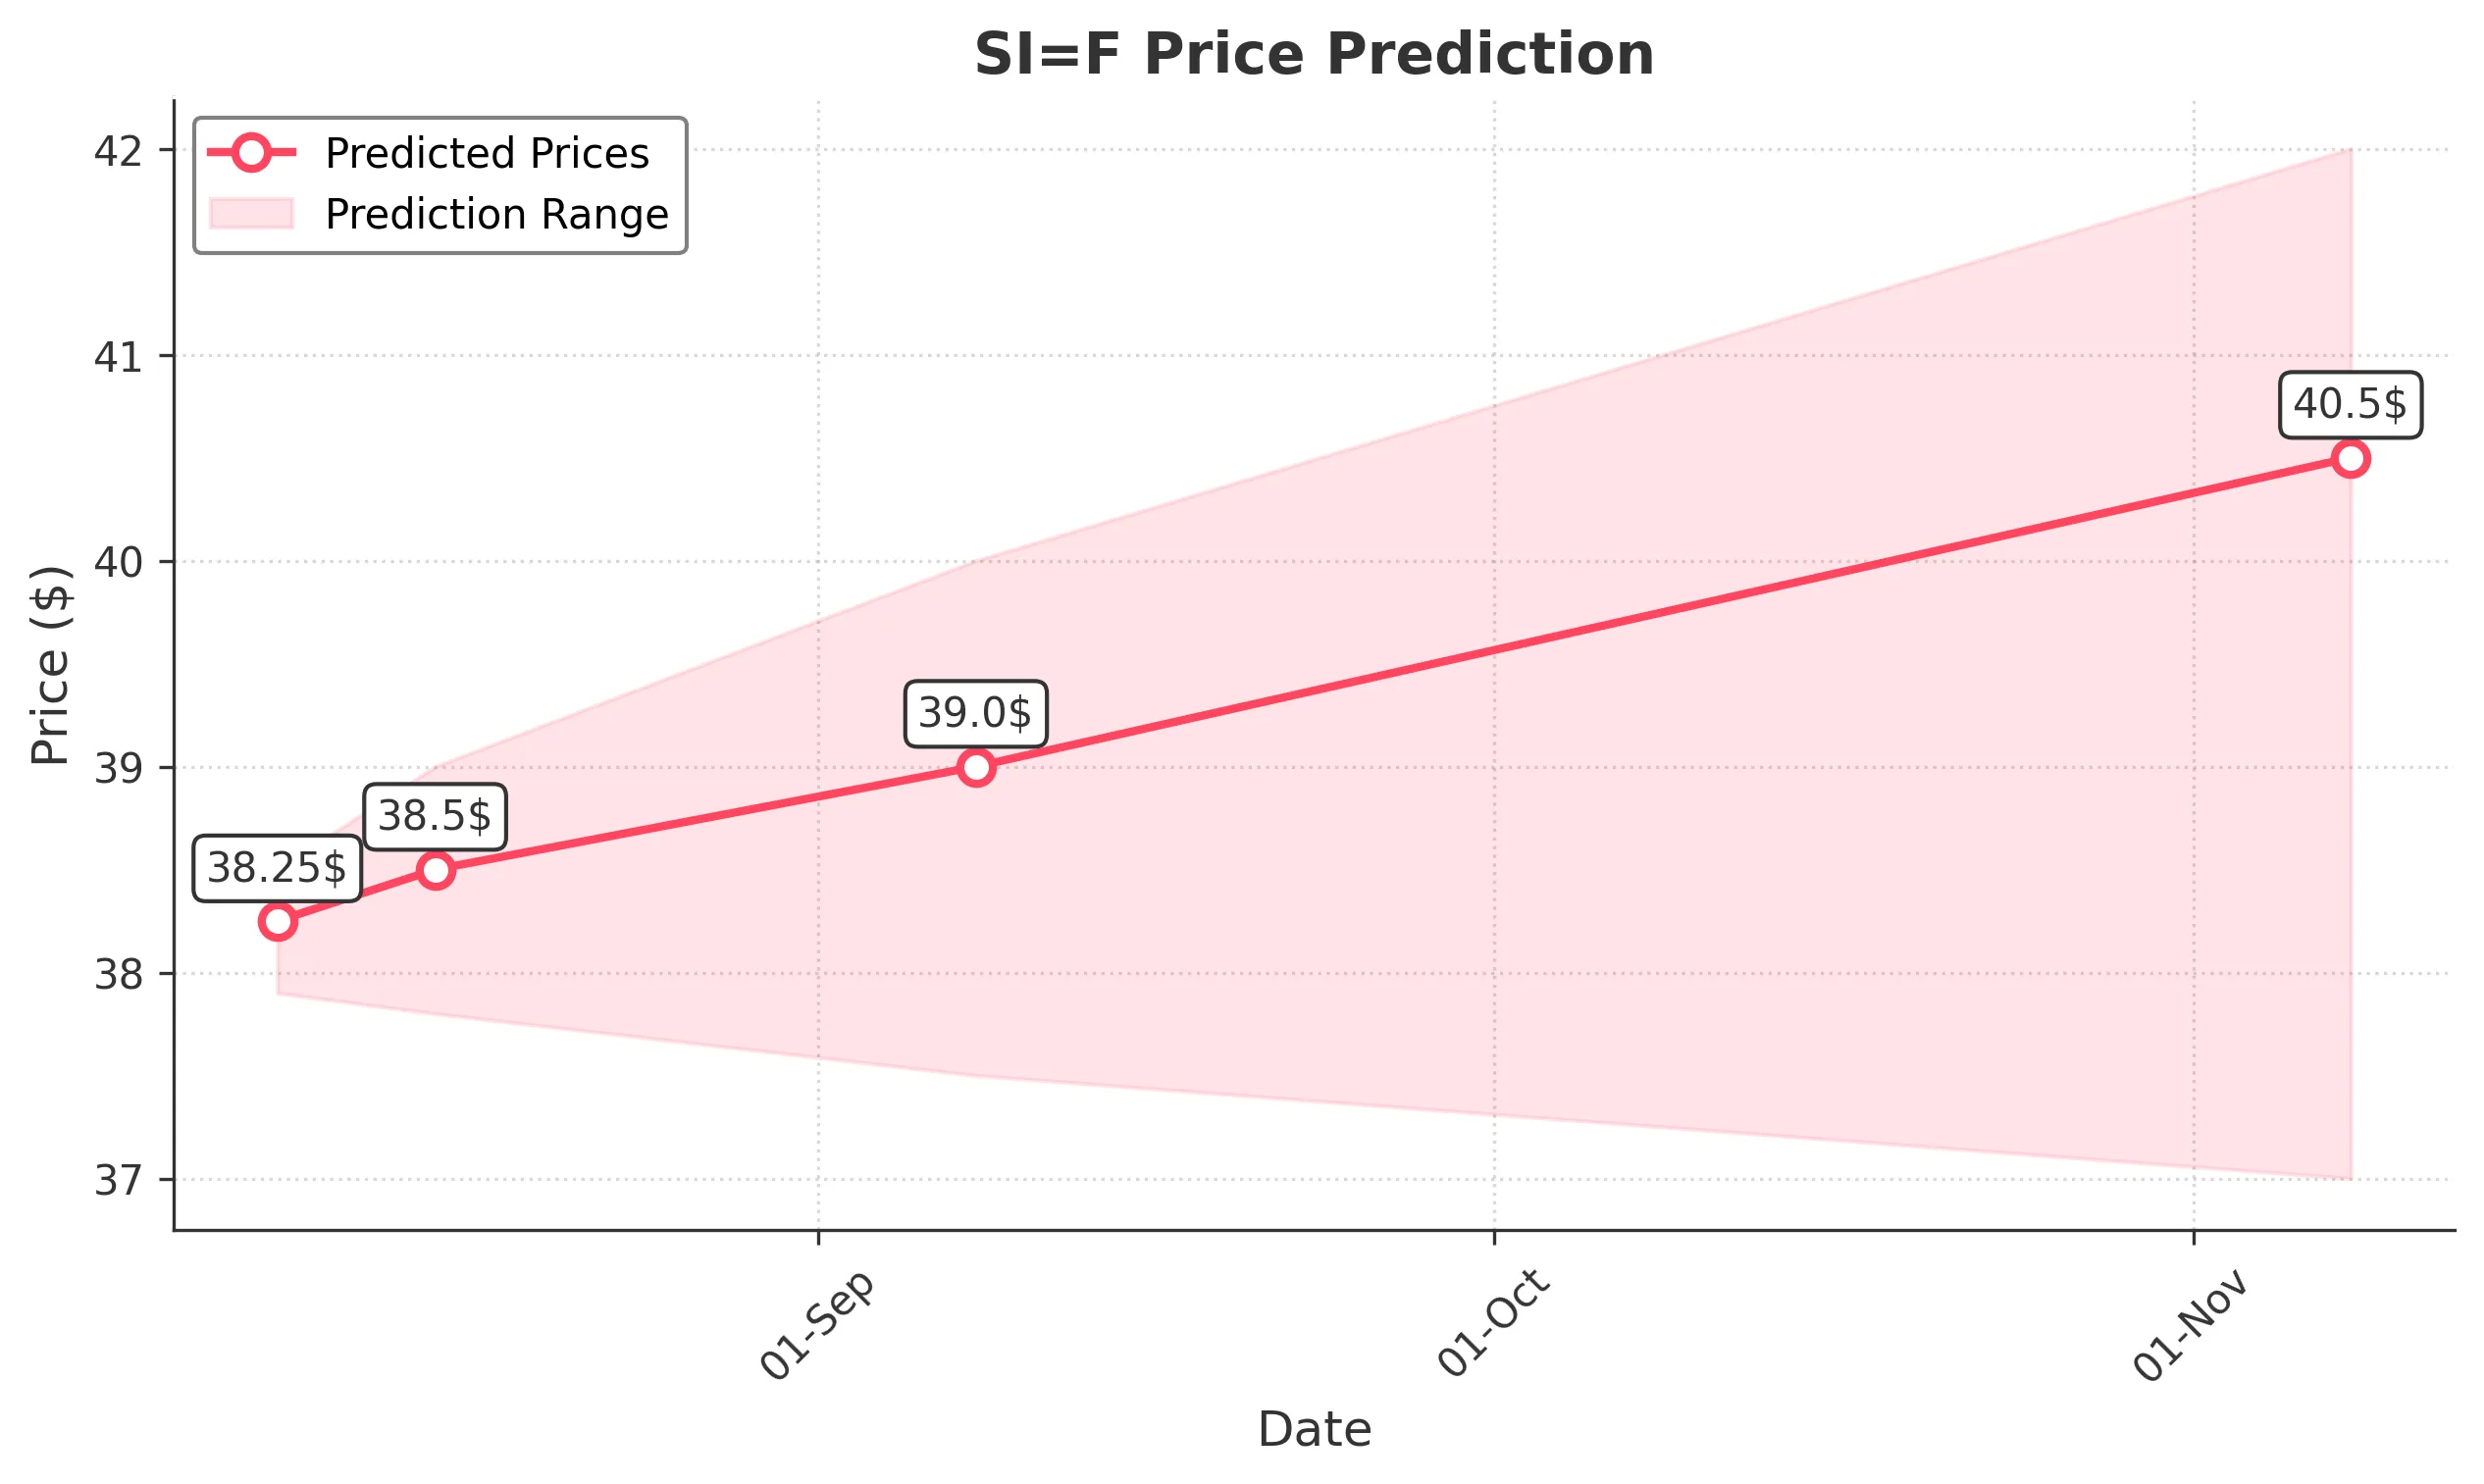
Target: August 8, 2025$38.25
$38.2
$38.5
$37.9
Description
The stock shows a bullish trend with a recent upward movement. The RSI is approaching overbought levels, indicating potential for a pullback. However, the MACD remains positive, suggesting continued momentum. Volume has been stable, supporting the price action.
Analysis
Over the past 3 months, SI=F has shown a bullish trend, with significant support at $36.00 and resistance around $39.00. The recent price action indicates strong buying interest, but the RSI nearing overbought levels suggests caution. Volume patterns have been consistent, with occasional spikes indicating interest.
Confidence Level
Potential Risks
Potential market volatility and profit-taking could lead to a price correction.
1 Week Prediction
Target: August 15, 2025$38.5
$38.3
$39
$37.8
Description
The stock is expected to maintain its upward trajectory, supported by bullish sentiment and positive technical indicators. The MACD remains above the signal line, and the price is above the 50-day moving average, indicating strength. Watch for potential resistance at $39.00.
Analysis
The stock has been in a bullish phase, with key support at $36.00 and resistance at $39.00. The MACD and moving averages indicate upward momentum, but the RSI suggests caution as it approaches overbought territory. Volume has been stable, indicating sustained interest.
Confidence Level
Potential Risks
Market sentiment can shift quickly, and external factors may impact performance.
1 Month Prediction
Target: September 8, 2025$39
$38.8
$40
$37.5
Description
The stock is likely to reach $39.00 as it approaches resistance levels. The bullish trend is supported by strong fundamentals and positive market sentiment. However, the RSI indicates potential overbought conditions, which could lead to a pullback.
Analysis
SI=F has shown a strong upward trend, with significant support at $36.00 and resistance at $39.00. The MACD and moving averages confirm bullish momentum, but the RSI nearing overbought levels suggests a possible correction. Volume patterns indicate healthy trading activity.
Confidence Level
Potential Risks
Economic data releases and geopolitical events could introduce volatility.
3 Months Prediction
Target: November 8, 2025$40.5
$39.5
$42
$37
Description
The stock is expected to continue its upward trend, potentially reaching $40.50. The bullish sentiment is supported by strong technical indicators, but caution is advised as the RSI may indicate overbought conditions. Market dynamics could influence price movements.
Analysis
Over the past three months, SI=F has demonstrated a bullish trend with key support at $36.00 and resistance at $39.00. The MACD and moving averages indicate positive momentum, but the RSI suggests caution as it approaches overbought levels. External factors could impact future performance.
Confidence Level
Potential Risks
Long-term predictions are subject to market volatility and economic changes.