SIF Trading Predictions
1 Day Prediction
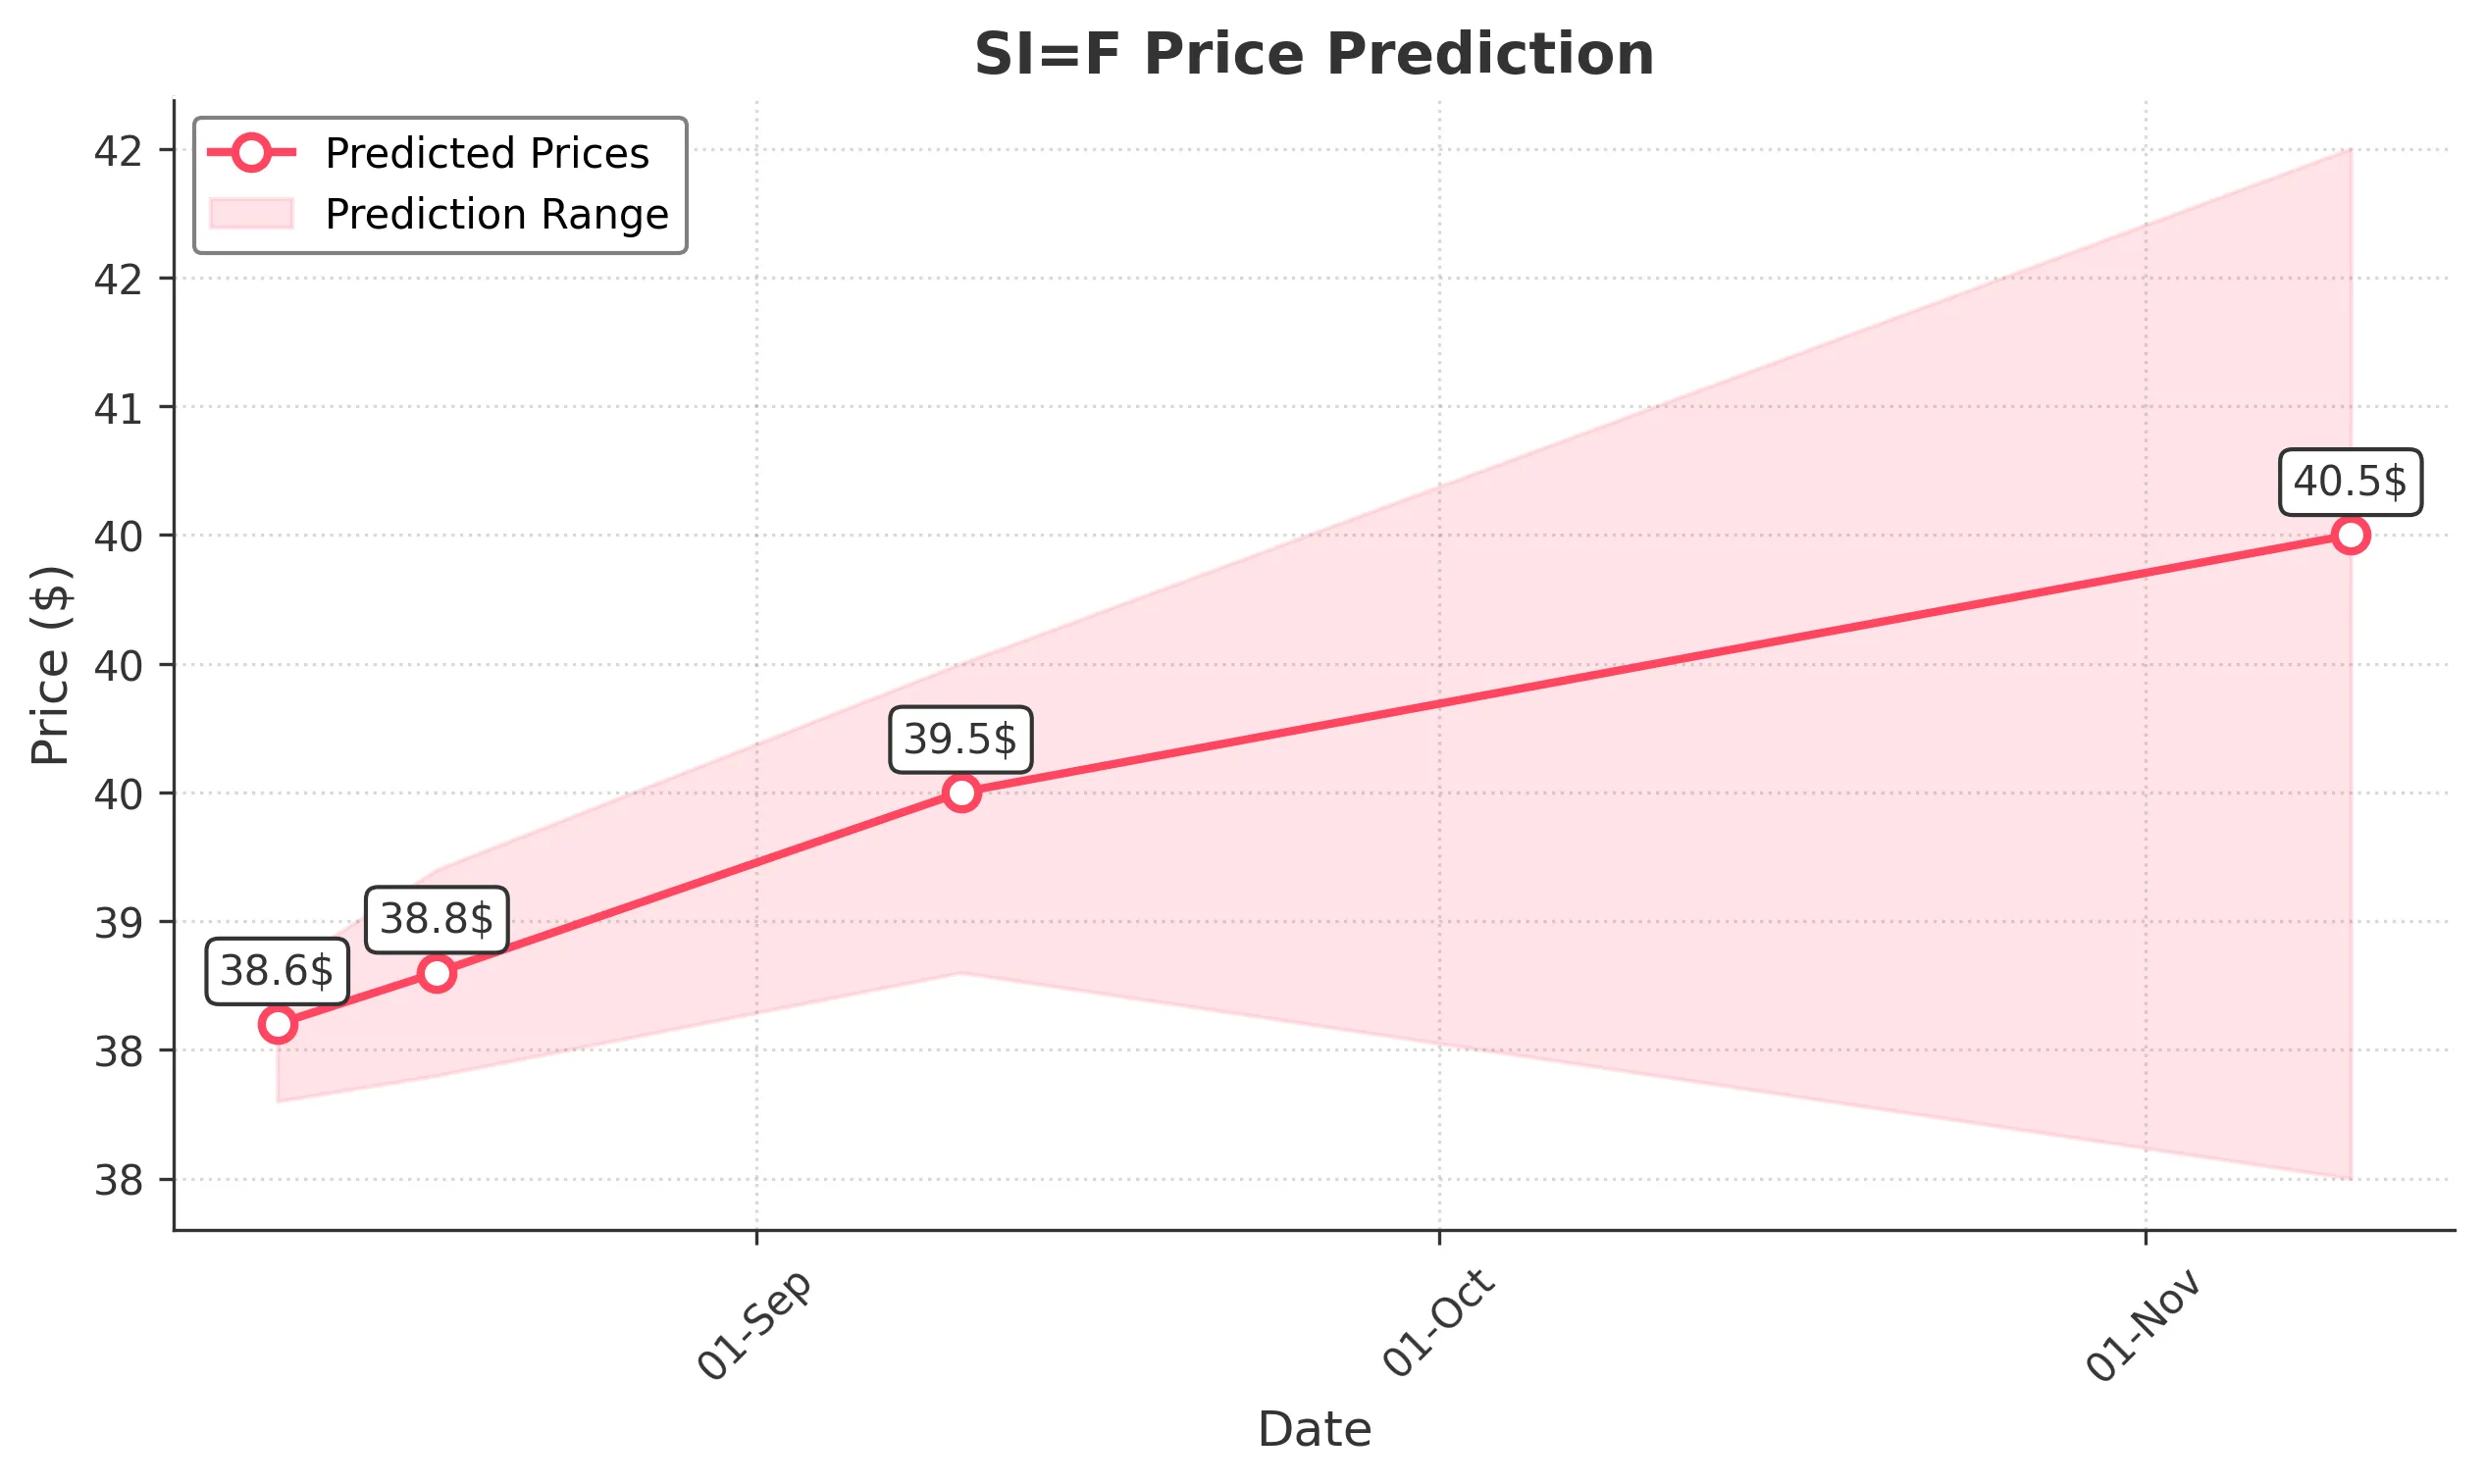
Target: August 11, 2025$38.6
$38.5
$38.8
$38.3
Description
The stock shows a bullish trend with a recent upward movement. The RSI is approaching overbought levels, indicating potential for a pullback. However, the MACD remains positive, suggesting continued momentum. Volume is stable, supporting the price action.
Analysis
Over the past 3 months, SI=F has shown a bullish trend, with significant support at $36.00 and resistance around $39.00. The MACD indicates upward momentum, while the RSI is nearing overbought territory. Volume has been consistent, with some spikes indicating strong buying interest.
Confidence Level
Potential Risks
Potential for a short-term pullback due to overbought RSI conditions.
1 Week Prediction
Target: August 18, 2025$38.8
$38.6
$39.2
$38.4
Description
The stock is expected to maintain its bullish trend, supported by strong recent performance. The MACD remains positive, and the price is above the 20-day moving average. However, the RSI indicates potential overbought conditions, which could lead to volatility.
Analysis
The stock has been trending upward, with key support at $36.00 and resistance at $39.00. The recent price action shows a strong bullish sentiment, but the RSI nearing overbought levels suggests caution. Volume patterns indicate healthy trading activity, but external market conditions could introduce volatility.
Confidence Level
Potential Risks
Market sentiment could shift due to external factors, impacting the bullish outlook.
1 Month Prediction
Target: September 10, 2025$39.5
$38.9
$40
$38.8
Description
The stock is likely to continue its upward trajectory, with strong support from recent bullish momentum. The MACD remains favorable, and the price is expected to test the $40.00 resistance level. However, the RSI suggests caution as it approaches overbought territory.
Analysis
SI=F has shown a consistent upward trend, with significant resistance at $40.00. The MACD indicates positive momentum, while the RSI suggests overbought conditions. Volume has been stable, but any negative news or market shifts could lead to a pullback.
Confidence Level
Potential Risks
Potential market corrections or external economic factors could impact the bullish trend.
3 Months Prediction
Target: November 10, 2025$40.5
$39
$42
$38
Description
The stock is expected to reach new highs, driven by strong bullish sentiment and positive technical indicators. However, the potential for market corrections exists, especially if the RSI remains in overbought territory. Watch for volume spikes as indicators of trend strength.
Analysis
Over the past three months, SI=F has shown a strong bullish trend, with key support at $36.00 and resistance at $40.00. The MACD indicates continued upward momentum, but the RSI suggests caution. Volume patterns indicate strong buying interest, but external factors could introduce volatility.
Confidence Level
Potential Risks
Long-term predictions are uncertain due to potential market volatility and economic changes.