SIF Trading Predictions
1 Day Prediction
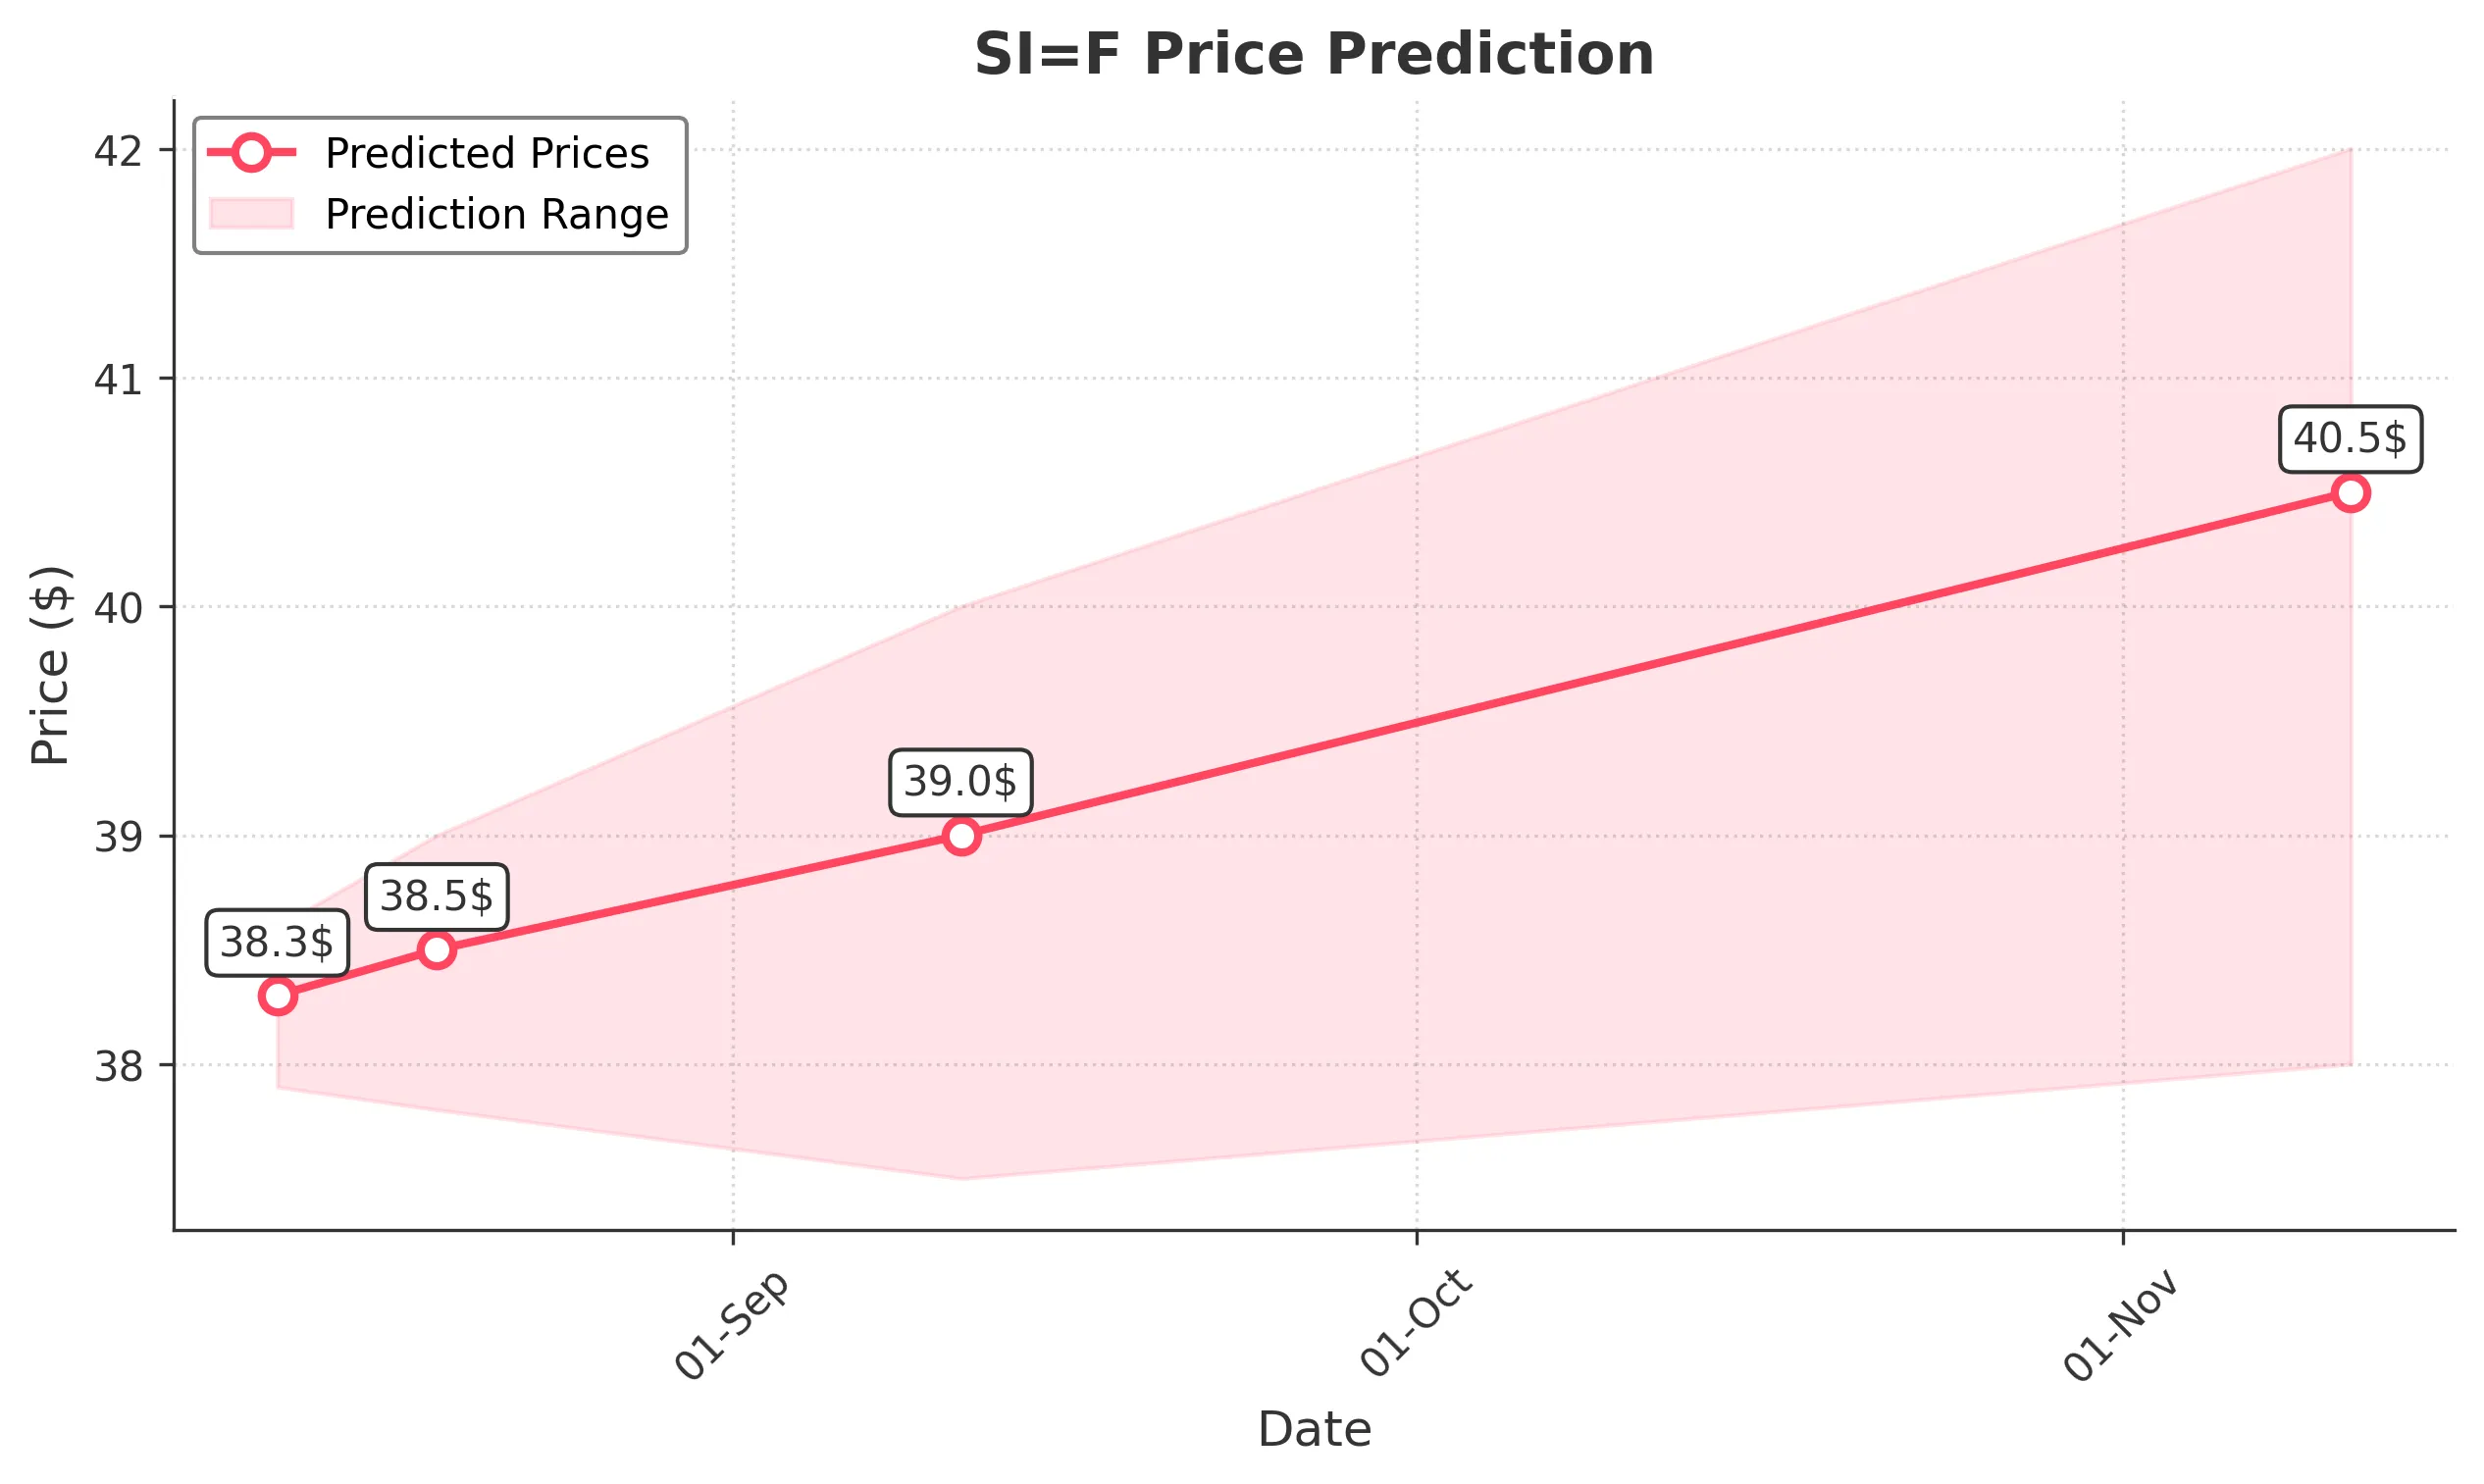
Target: August 12, 2025$38.3
$38.2
$38.6
$37.9
Description
The stock shows a bullish trend with a recent close of 38.200. The RSI is approaching overbought levels, indicating potential for a pullback. However, the MACD is positive, suggesting upward momentum. Volume has been increasing, supporting the bullish outlook.
Analysis
Over the past 3 months, SI=F has shown a bullish trend, with significant support at 36.000 and resistance around 39.000. The MACD and moving averages indicate upward momentum, while recent volume spikes suggest strong buying interest. However, RSI nearing overbought levels raises concerns about a potential pullback.
Confidence Level
Potential Risks
Potential market volatility and profit-taking could lead to a price drop.
1 Week Prediction
Target: August 19, 2025$38.5
$38.3
$39
$37.8
Description
The stock is expected to maintain its bullish trend, with the MACD remaining positive. However, the RSI indicates overbought conditions, which may lead to a short-term correction. Volume trends suggest continued interest, but caution is advised.
Analysis
The stock has been on an upward trajectory, with key support at 36.000 and resistance at 39.000. The recent bullish candlestick patterns and increasing volume indicate strong buying pressure. However, the overbought RSI suggests a potential pullback could occur.
Confidence Level
Potential Risks
Market sentiment could shift due to external factors, impacting the stock's performance.
1 Month Prediction
Target: September 11, 2025$39
$38.5
$40
$37.5
Description
The stock is likely to continue its upward trend, supported by strong fundamentals and positive market sentiment. However, the RSI indicates potential overbought conditions, which could lead to volatility. Watch for any bearish reversal patterns.
Analysis
SI=F has shown a strong bullish trend with significant resistance at 39.000. The MACD and moving averages support continued upward movement, but the RSI suggests caution due to overbought conditions. Volume patterns indicate strong interest, but external factors could introduce volatility.
Confidence Level
Potential Risks
Economic indicators and market news could influence stock performance, leading to unexpected volatility.
3 Months Prediction
Target: November 11, 2025$40.5
$39
$42
$38
Description
Long-term outlook remains bullish, with potential for further gains. However, the stock may face resistance at 40.000. The market sentiment is positive, but external economic factors could introduce volatility.
Analysis
The stock has been on a bullish trend, with key support at 36.000 and resistance at 40.000. The MACD and moving averages indicate upward momentum, but the RSI suggests caution. Volume patterns show strong buying interest, but external factors could lead to volatility.
Confidence Level
Potential Risks
Unforeseen macroeconomic events or shifts in market sentiment could impact the stock's trajectory.