SIF Trading Predictions
1 Day Prediction
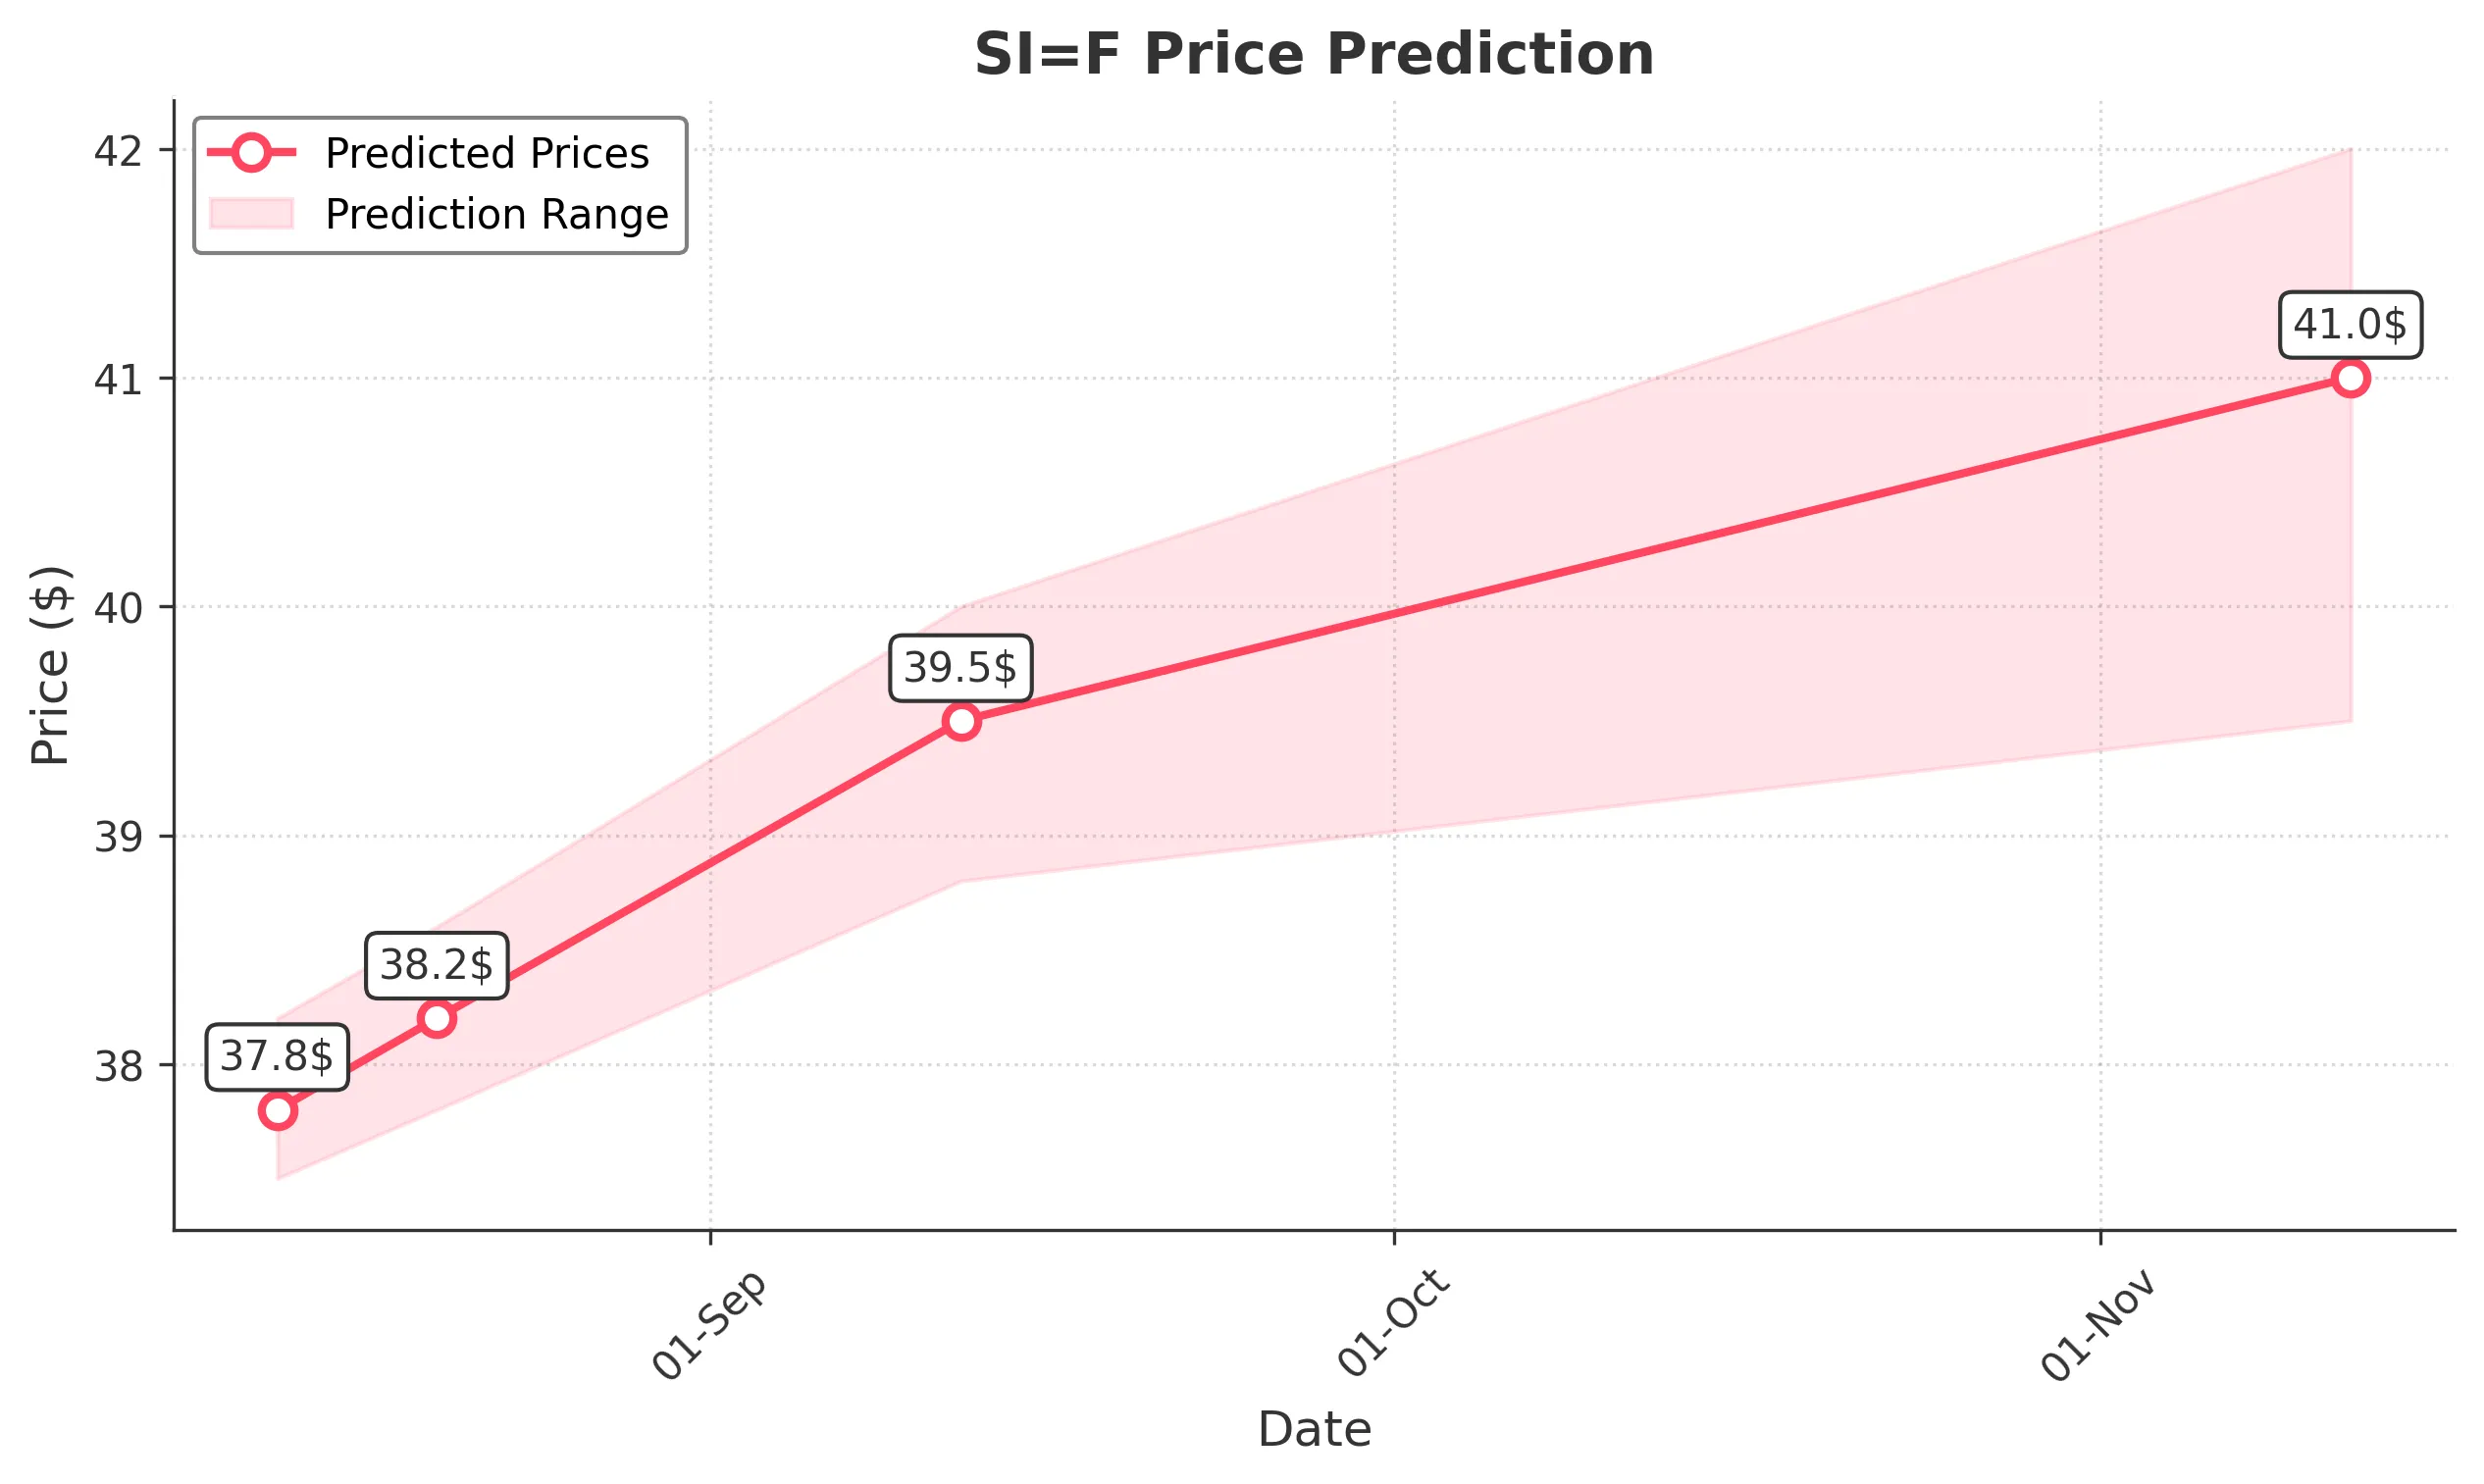
Target: August 13, 2025$37.8
$37.9
$38.2
$37.5
Description
The stock shows a slight bullish trend with a recent Doji candlestick indicating indecision. RSI is near 60, suggesting upward momentum. However, MACD is flattening, indicating potential resistance ahead.
Analysis
Over the past 3 months, SI=F has shown a bullish trend with significant support at $36.00 and resistance around $39.00. The RSI indicates strength, but recent volume spikes suggest caution. The stock is currently in a consolidation phase.
Confidence Level
Potential Risks
Market volatility and external news could impact the price. A bearish reversal is possible if the stock fails to break above recent highs.
1 Week Prediction
Target: August 20, 2025$38.2
$38
$38.6
$37.8
Description
The stock is expected to continue its upward trajectory, supported by a bullish MACD crossover. However, the RSI nearing overbought levels may lead to a pullback. Watch for volume trends.
Analysis
The stock has been trending upward with key support at $37.50. The recent bullish candlestick patterns and increasing volume suggest continued interest. However, the market sentiment remains mixed.
Confidence Level
Potential Risks
Potential market corrections or negative news could reverse the trend. A failure to maintain volume could indicate weakening momentum.
1 Month Prediction
Target: September 12, 2025$39.5
$39
$40
$38.8
Description
Expect a gradual rise as the stock approaches resistance levels. The Fibonacci retracement suggests a target near $40.00. However, watch for bearish divergence in RSI.
Analysis
The stock has shown strong performance with a bullish trend. Key resistance at $40.00 may pose challenges. Volume patterns indicate strong buying interest, but caution is warranted as the stock approaches overbought conditions.
Confidence Level
Potential Risks
Market corrections and external economic factors could hinder growth. A significant drop in volume may signal a reversal.
3 Months Prediction
Target: November 12, 2025$41
$40.5
$42
$39.5
Description
Long-term bullish outlook supported by strong fundamentals and technical indicators. However, potential market corrections could lead to volatility.
Analysis
The stock has been on a bullish run, with key support at $39.00 and resistance at $42.00. Technical indicators suggest continued strength, but external factors could introduce volatility. A balanced view is necessary as the market evolves.
Confidence Level
Potential Risks
Unforeseen macroeconomic events or changes in market sentiment could significantly impact the stock's performance. Watch for signs of exhaustion in the rally.