SIF Trading Predictions
1 Day Prediction
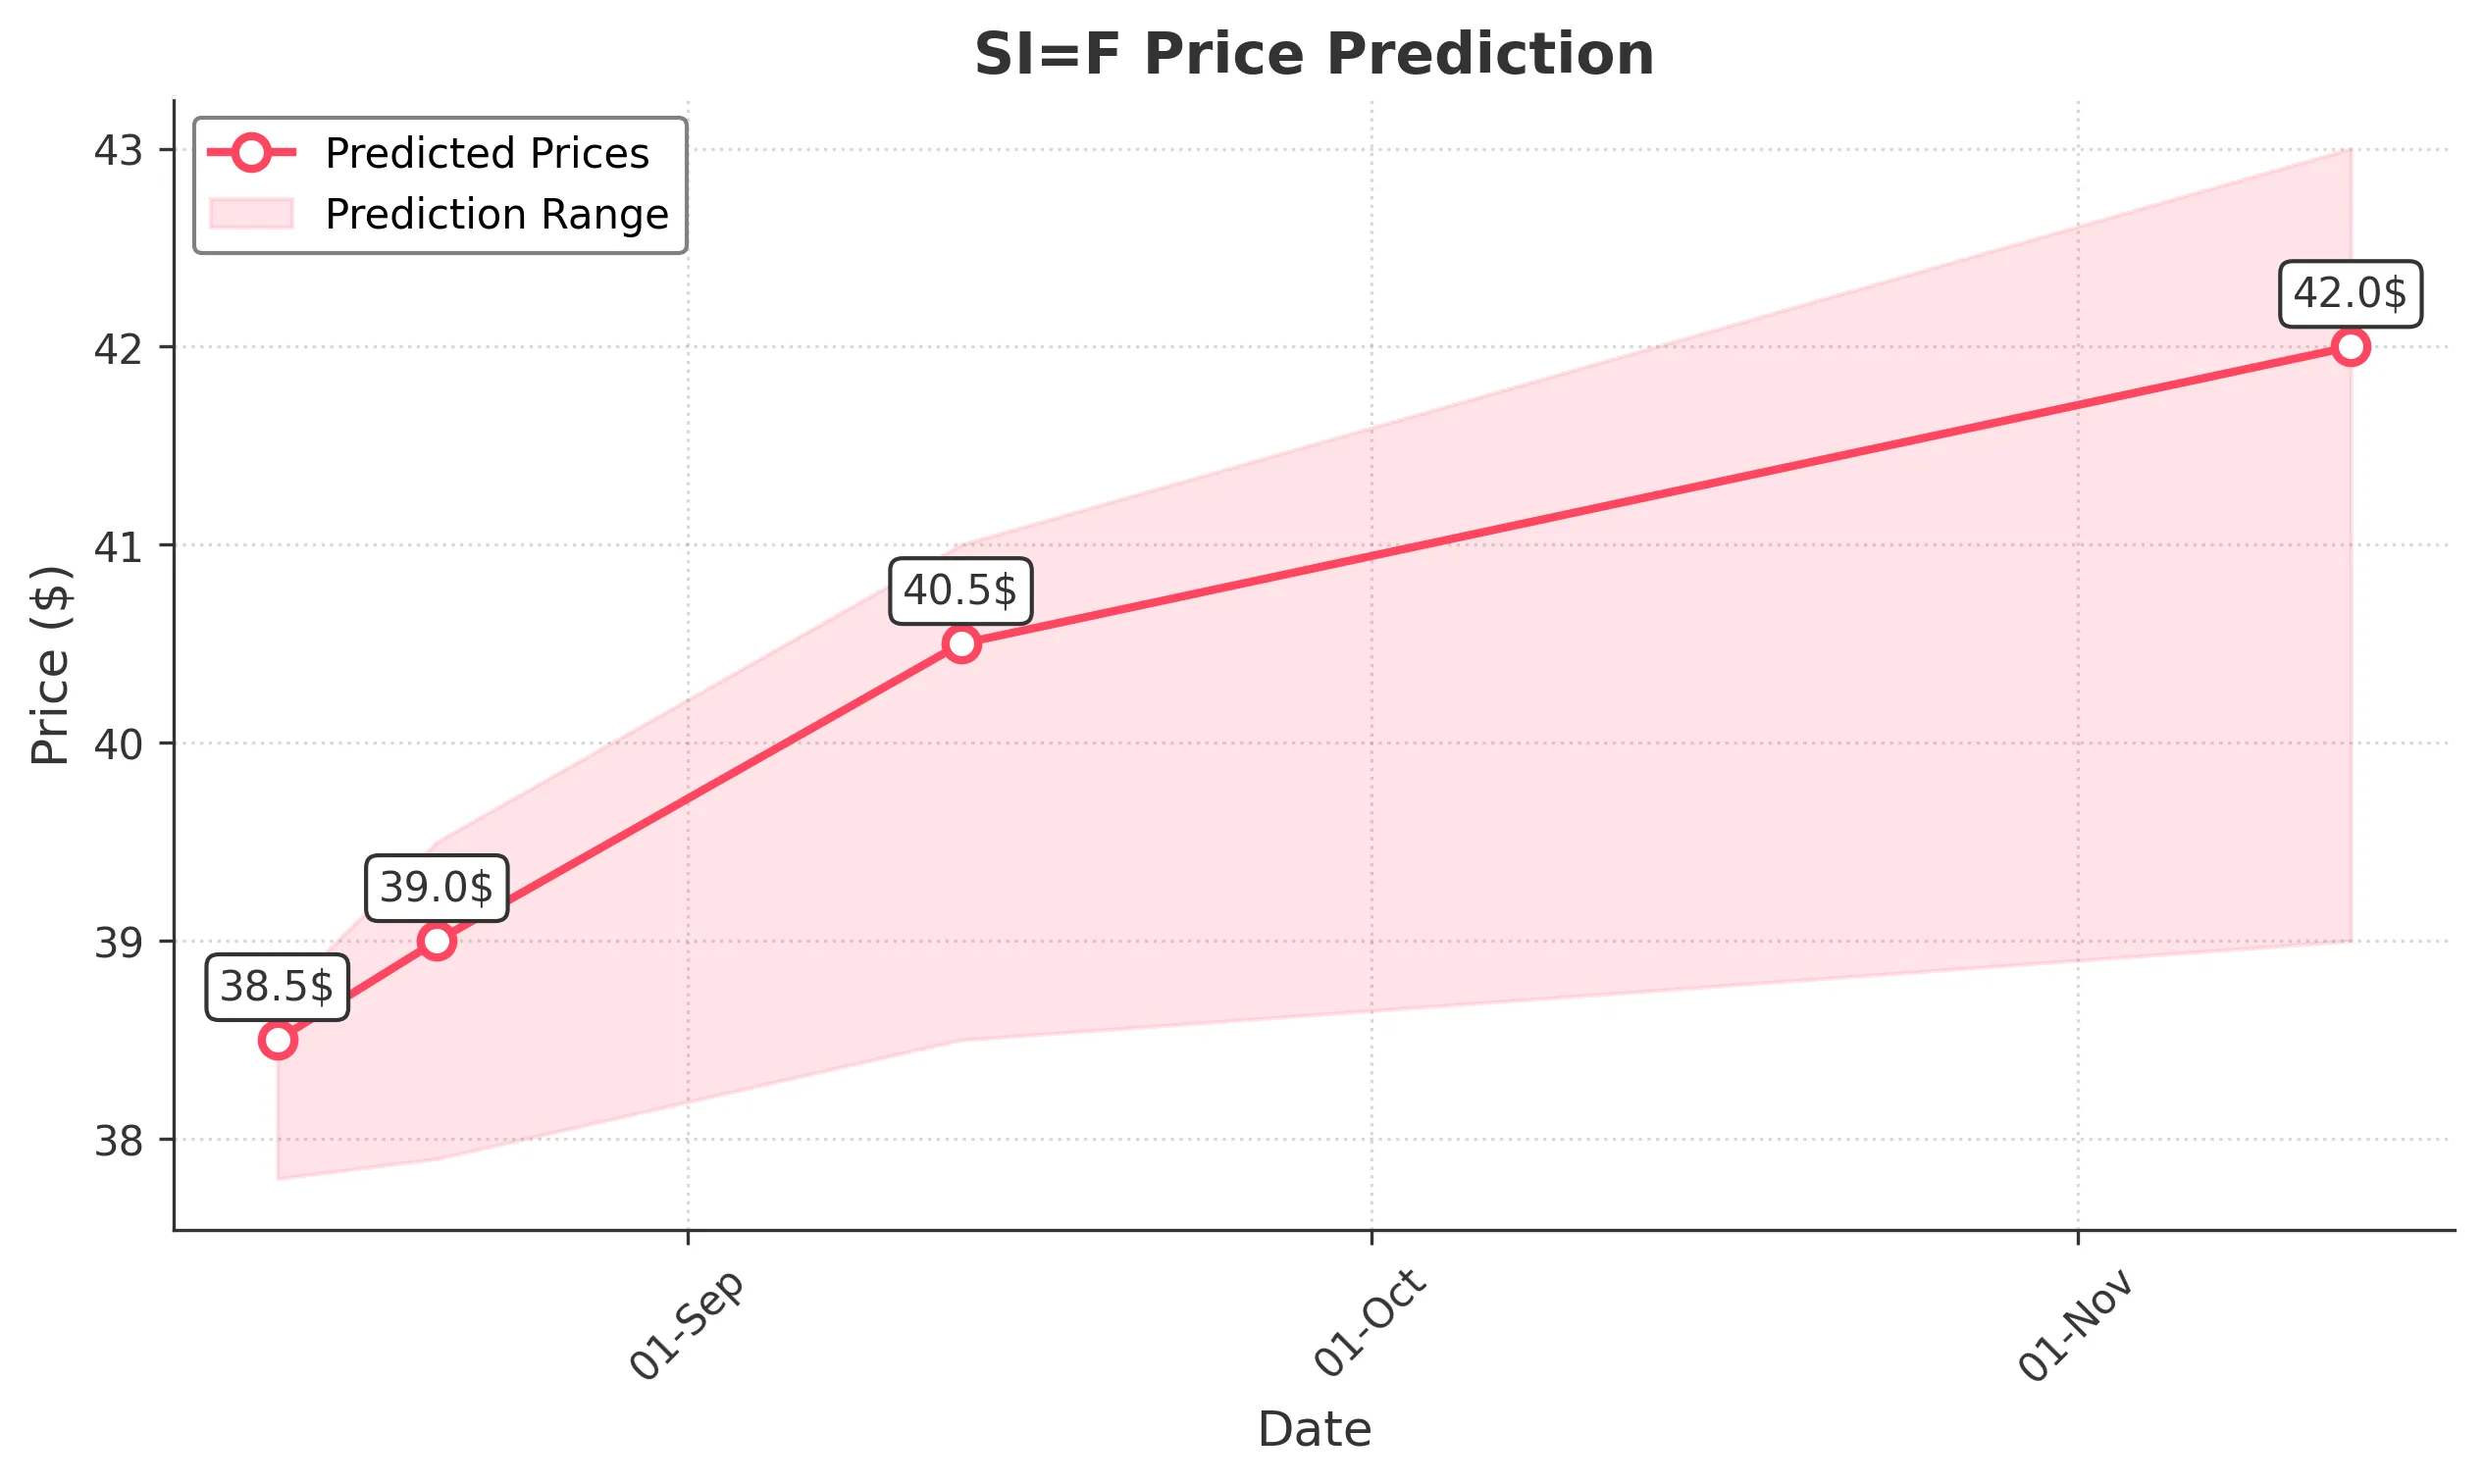
Target: August 14, 2025$38.5
$38.2
$38.7
$37.8
Description
The stock shows a bullish trend with a recent upward movement. The RSI is approaching overbought levels, indicating potential for a pullback. However, the MACD is positive, suggesting continued momentum. Volume has been stable, supporting the price action.
Analysis
Over the past 3 months, SI=F has shown a bullish trend, with significant support at $36.00 and resistance around $39.00. The recent price action indicates strong buying interest, but the RSI nearing overbought levels suggests caution. Volume patterns have been consistent, with occasional spikes indicating interest.
Confidence Level
Potential Risks
Potential market volatility and profit-taking could lead to a price correction.
1 Week Prediction
Target: August 21, 2025$39
$38.8
$39.5
$37.9
Description
The stock is expected to continue its upward trajectory, supported by bullish sentiment and positive technical indicators. The MACD remains bullish, and the price is above the 50-day moving average, indicating strength. However, watch for potential resistance at $39.50.
Analysis
The stock has been in a bullish phase, with key support at $36.00 and resistance at $39.50. The MACD and moving averages indicate upward momentum, but the RSI suggests caution as it approaches overbought territory. Volume has been stable, indicating sustained interest.
Confidence Level
Potential Risks
Market sentiment can shift quickly, and external factors may impact the stock's performance.
1 Month Prediction
Target: September 13, 2025$40.5
$39
$41
$38.5
Description
The stock is likely to reach new highs as bullish momentum continues. The recent breakout above resistance levels suggests further upside potential. However, the RSI indicates overbought conditions, which may lead to short-term corrections.
Analysis
SI=F has shown strong bullish trends, with significant resistance at $41.00. The MACD and moving averages support continued upward movement, but the RSI indicates potential overbought conditions. Volume patterns suggest sustained interest, but caution is warranted.
Confidence Level
Potential Risks
Market corrections and external economic factors could impact the stock's upward trajectory.
3 Months Prediction
Target: November 13, 2025$42
$40.5
$43
$39
Description
Long-term bullish sentiment is expected to drive the stock higher, with potential for new highs. However, the market may experience volatility due to macroeconomic factors. The stock's fundamentals remain strong, supporting the upward trend.
Analysis
The stock has maintained a bullish trend, with key support at $39.00 and resistance at $43.00. Technical indicators suggest continued strength, but the potential for market volatility exists. Volume patterns indicate interest, but external factors could impact performance.
Confidence Level
Potential Risks
Unforeseen economic events and market corrections could lead to significant price fluctuations.