SIF Trading Predictions
1 Day Prediction
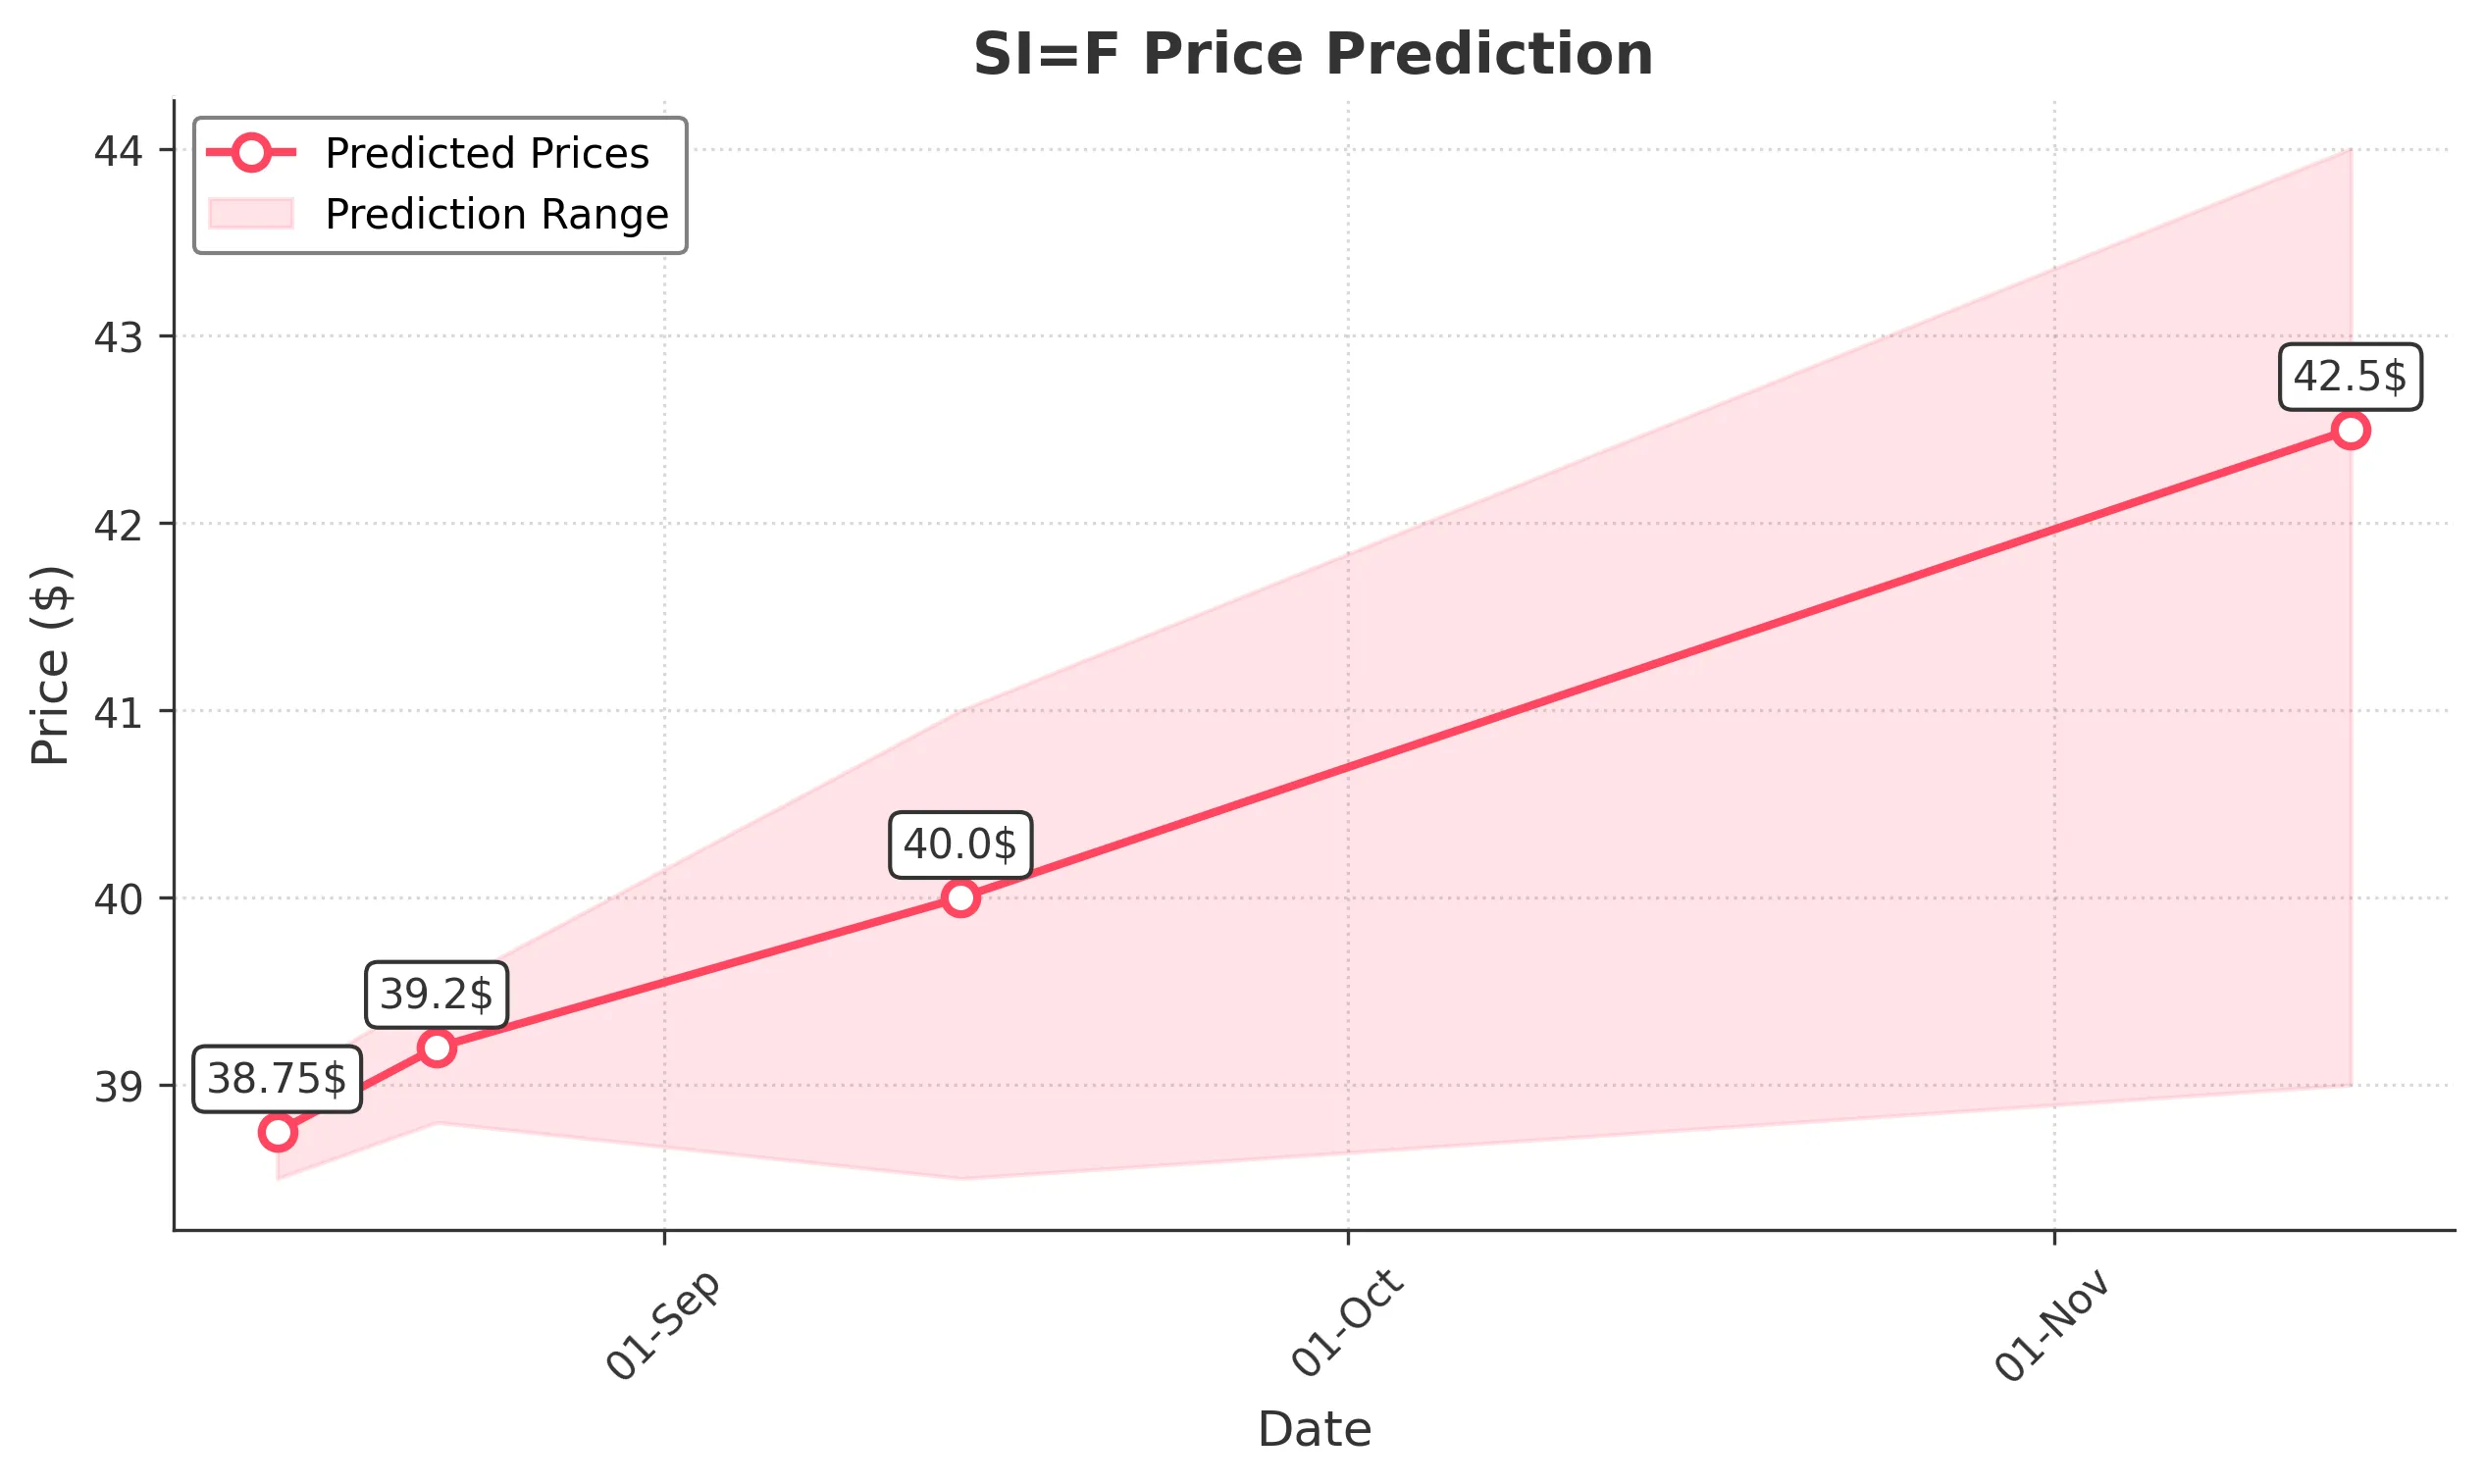
Target: August 15, 2025$38.75
$38.6
$39
$38.5
Description
The stock shows bullish momentum with a recent close above the 20-day moving average. RSI is nearing overbought levels, indicating potential for a pullback. However, strong volume suggests continued interest. Watch for resistance at 39.00.
Analysis
The stock has been in a bullish trend, recently breaking above key resistance levels. The 20-day moving average supports upward momentum. Volume has been stable, with occasional spikes indicating strong buying interest. However, RSI nearing overbought levels suggests caution.
Confidence Level
Potential Risks
Potential for a pullback if RSI exceeds overbought levels. Market sentiment could shift due to external factors.
1 Week Prediction
Target: August 22, 2025$39.2
$38.9
$39.5
$38.8
Description
The stock is expected to continue its upward trajectory, supported by bullish candlestick patterns and a favorable MACD crossover. However, resistance at 39.50 may limit gains. Monitor for volume spikes indicating strong buying pressure.
Analysis
The stock has shown consistent upward movement, with key support at 38.00. Technical indicators suggest bullish momentum, but the proximity to resistance levels raises concerns about potential reversals. Volume patterns indicate healthy trading activity.
Confidence Level
Potential Risks
Resistance at 39.50 could trigger profit-taking. Market volatility and external news may impact performance.
1 Month Prediction
Target: September 14, 2025$40
$39.5
$41
$38.5
Description
A bullish outlook is anticipated as the stock approaches key Fibonacci retracement levels. The MACD remains positive, and the RSI is stabilizing. However, external market conditions could introduce volatility.
Analysis
The stock has been trending upward, with significant support at 38.00. Technical indicators suggest continued bullish momentum, but potential resistance at 41.00 could limit gains. Volume analysis shows healthy trading, but external factors may introduce uncertainty.
Confidence Level
Potential Risks
Market sentiment may shift due to macroeconomic events, impacting the stock's upward trajectory.
3 Months Prediction
Target: November 14, 2025$42.5
$40.5
$44
$39
Description
Long-term bullish sentiment is supported by strong fundamentals and technical indicators. However, potential market corrections and economic shifts could impact performance. Watch for key support at 40.00.
Analysis
The stock has shown a strong bullish trend over the past months, with key support at 40.00. Technical indicators suggest potential for further gains, but market volatility and external factors could introduce risks. A balanced view is necessary as the stock approaches higher resistance levels.
Confidence Level
Potential Risks
Unforeseen macroeconomic events could lead to volatility. The stock may face resistance at higher levels.