SOL-USD Trading Predictions
1 Day Prediction
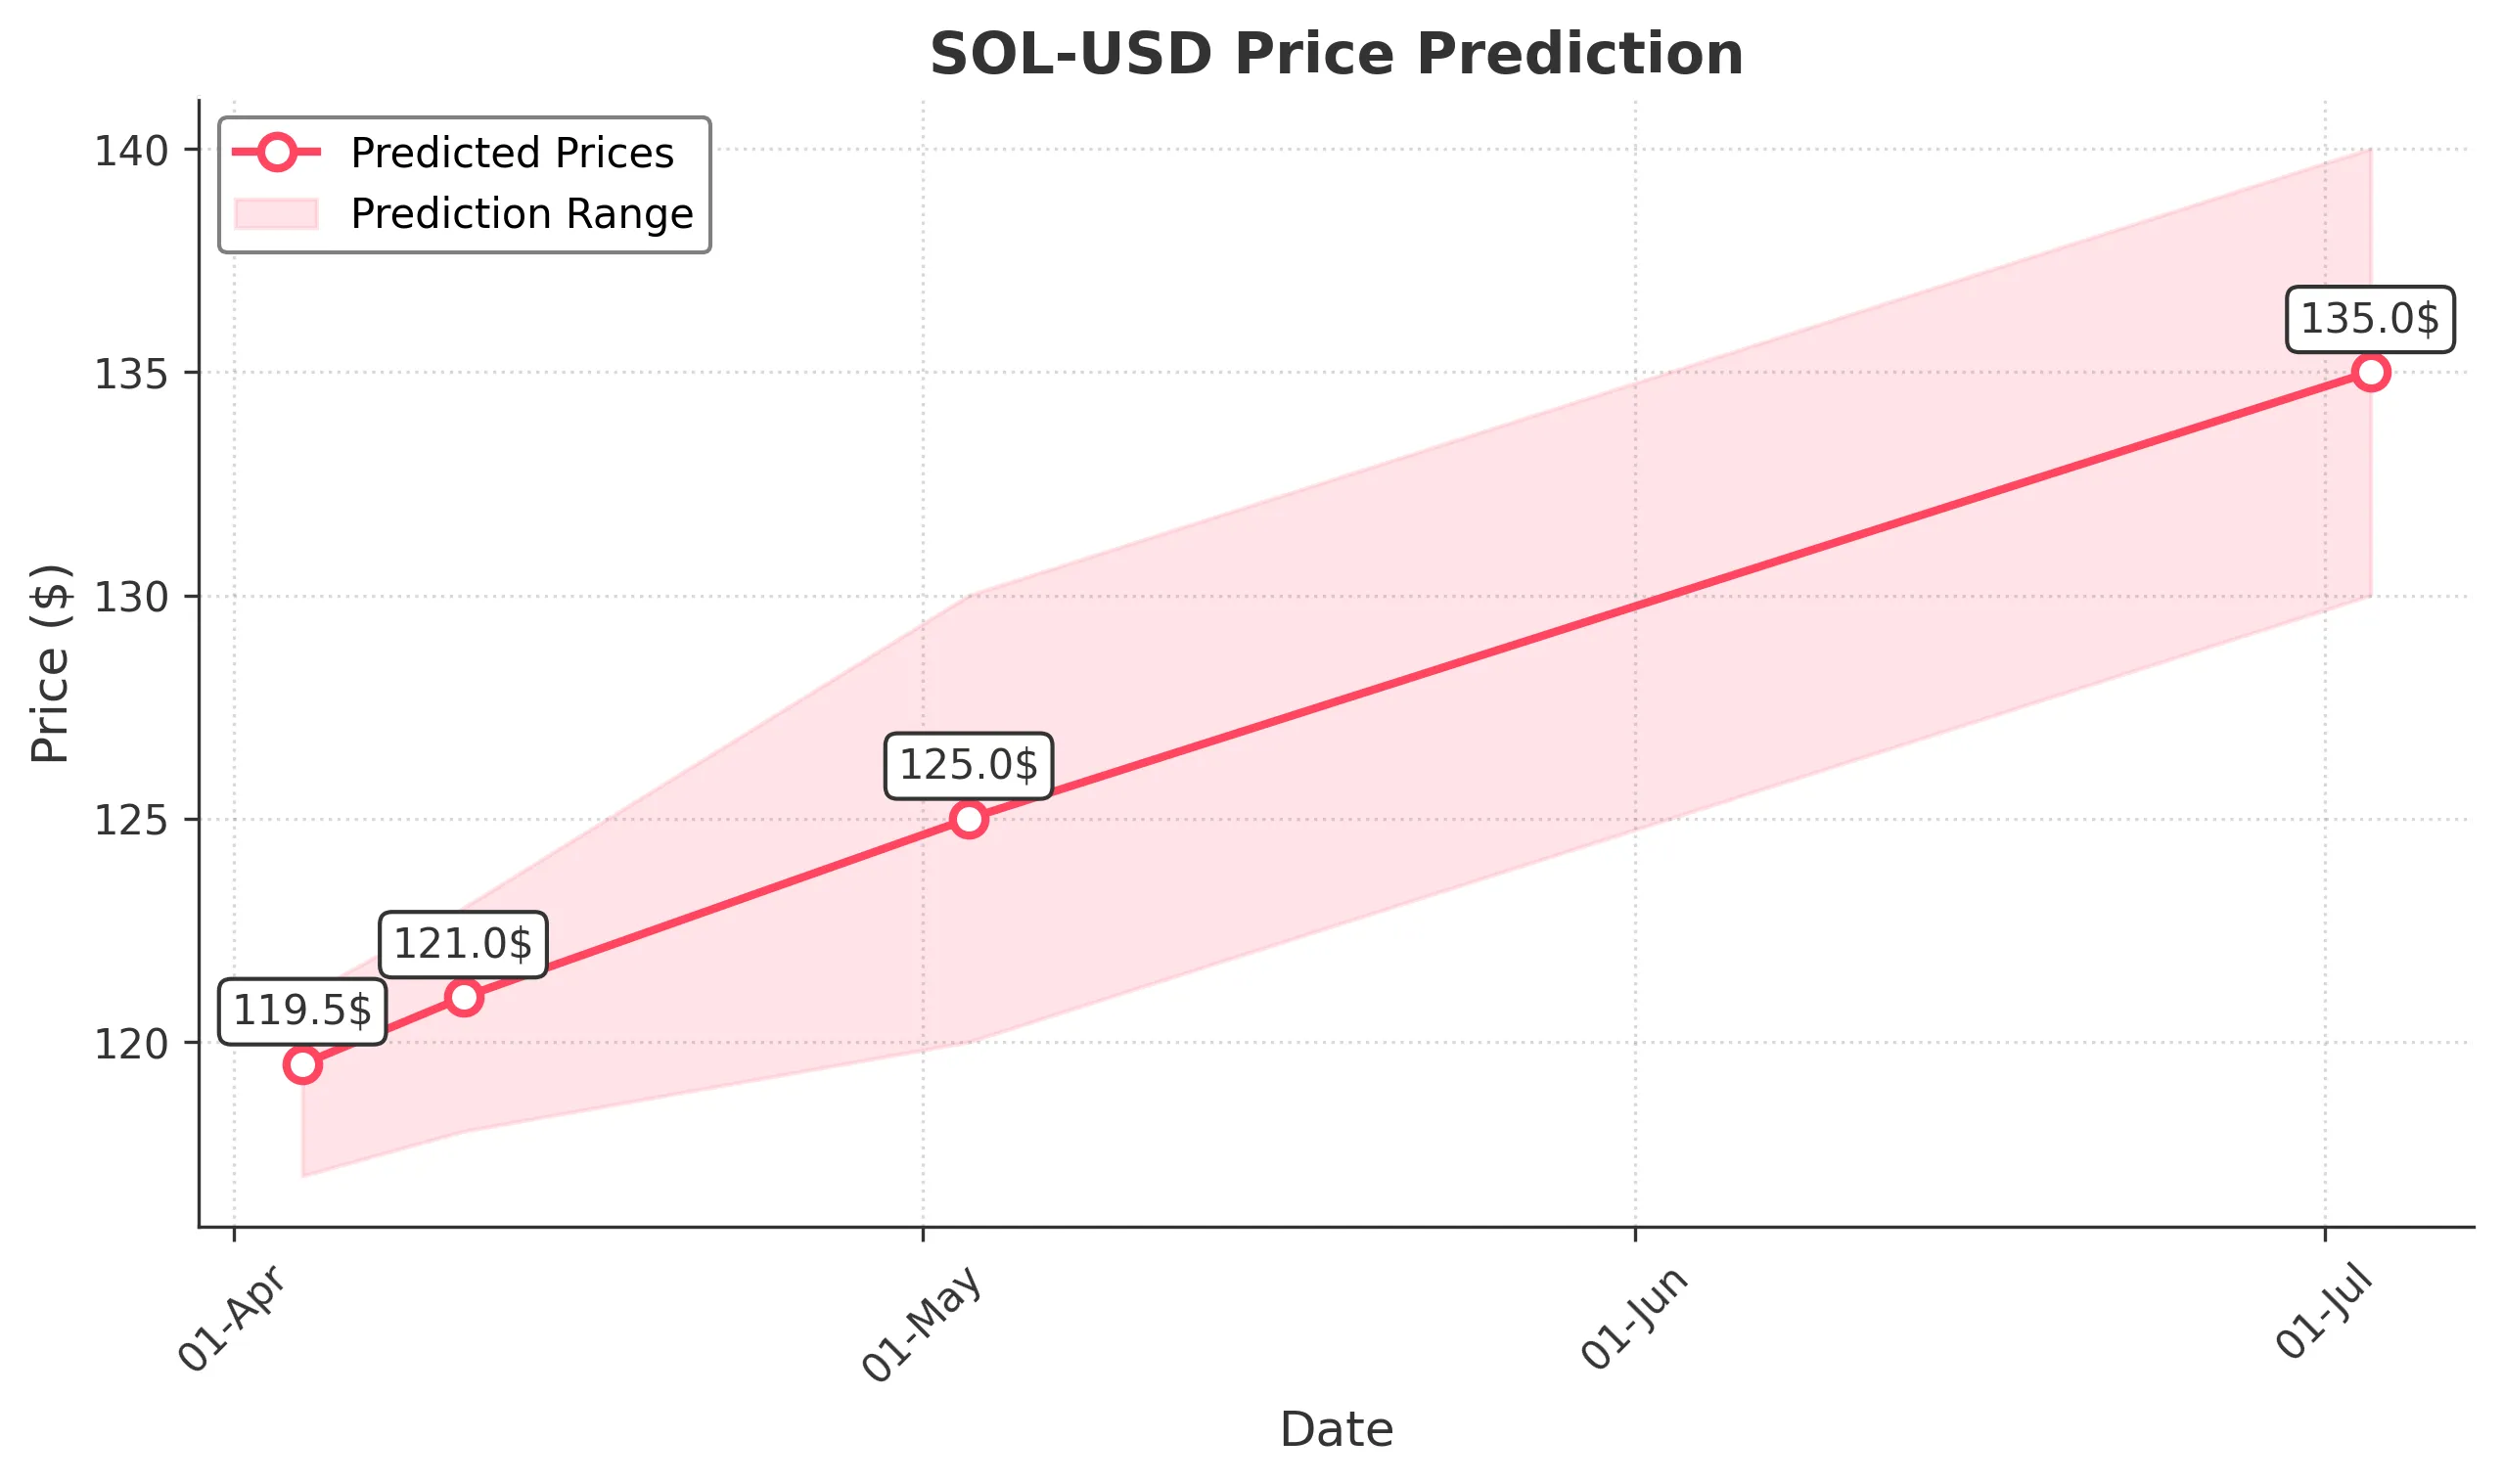
Target: April 4, 2025$119.5
$118.5
$121
$117
Description
The stock shows a slight bullish trend with a potential recovery from recent lows. RSI indicates oversold conditions, suggesting a bounce. However, MACD remains bearish, indicating caution. Volume spikes may signal increased interest.
Analysis
Over the past 3 months, SOL-USD has experienced significant volatility, with a bearish trend recently. Key support at $117.00 and resistance at $135.00. RSI indicates oversold conditions, while MACD shows bearish momentum. Volume patterns suggest increased trading activity, indicating potential for recovery.
Confidence Level
Potential Risks
Market volatility and external news could impact the prediction. A reversal is possible if bearish sentiment persists.
1 Week Prediction
Target: April 11, 2025$121
$119.5
$123
$118
Description
A potential upward movement is expected as the stock may find support at $117.00. The RSI is improving, indicating a possible reversal. However, MACD remains bearish, suggesting caution. Volume may increase as traders react to price movements.
Analysis
The stock has shown a bearish trend with significant fluctuations. Support at $117.00 is critical, while resistance is at $135.00. Recent volume spikes indicate heightened interest, but the overall sentiment remains cautious. Technical indicators suggest potential for a short-term recovery.
Confidence Level
Potential Risks
Unforeseen market events or negative sentiment could hinder recovery. The bearish MACD signal raises concerns about sustainability.
1 Month Prediction
Target: May 3, 2025$125
$121
$130
$120
Description
A gradual recovery is anticipated as the stock stabilizes. RSI may approach neutral levels, indicating reduced selling pressure. However, MACD remains a concern. Volume may increase as traders react to market conditions.
Analysis
The stock has been in a bearish trend, with significant price fluctuations. Key support at $117.00 and resistance at $135.00. Volume patterns indicate increased trading activity, but overall sentiment remains cautious. Technical indicators suggest potential for stabilization.
Confidence Level
Potential Risks
Market sentiment and external factors could lead to unexpected volatility. The bearish MACD signal suggests caution.
3 Months Prediction
Target: July 3, 2025$135
$132
$140
$130
Description
A potential recovery to $135.00 is expected as the stock may stabilize. RSI could improve, indicating reduced selling pressure. However, macroeconomic factors and market sentiment could impact this prediction.
Analysis
The stock has shown significant volatility with a bearish trend. Key support at $117.00 and resistance at $135.00. Volume patterns indicate increased trading activity, but overall sentiment remains cautious. Technical indicators suggest potential for stabilization, but risks remain.
Confidence Level
Potential Risks
Unforeseen market events or negative sentiment could hinder recovery. The overall bearish trend raises concerns about sustainability.