SOL-USD Trading Predictions
1 Day Prediction
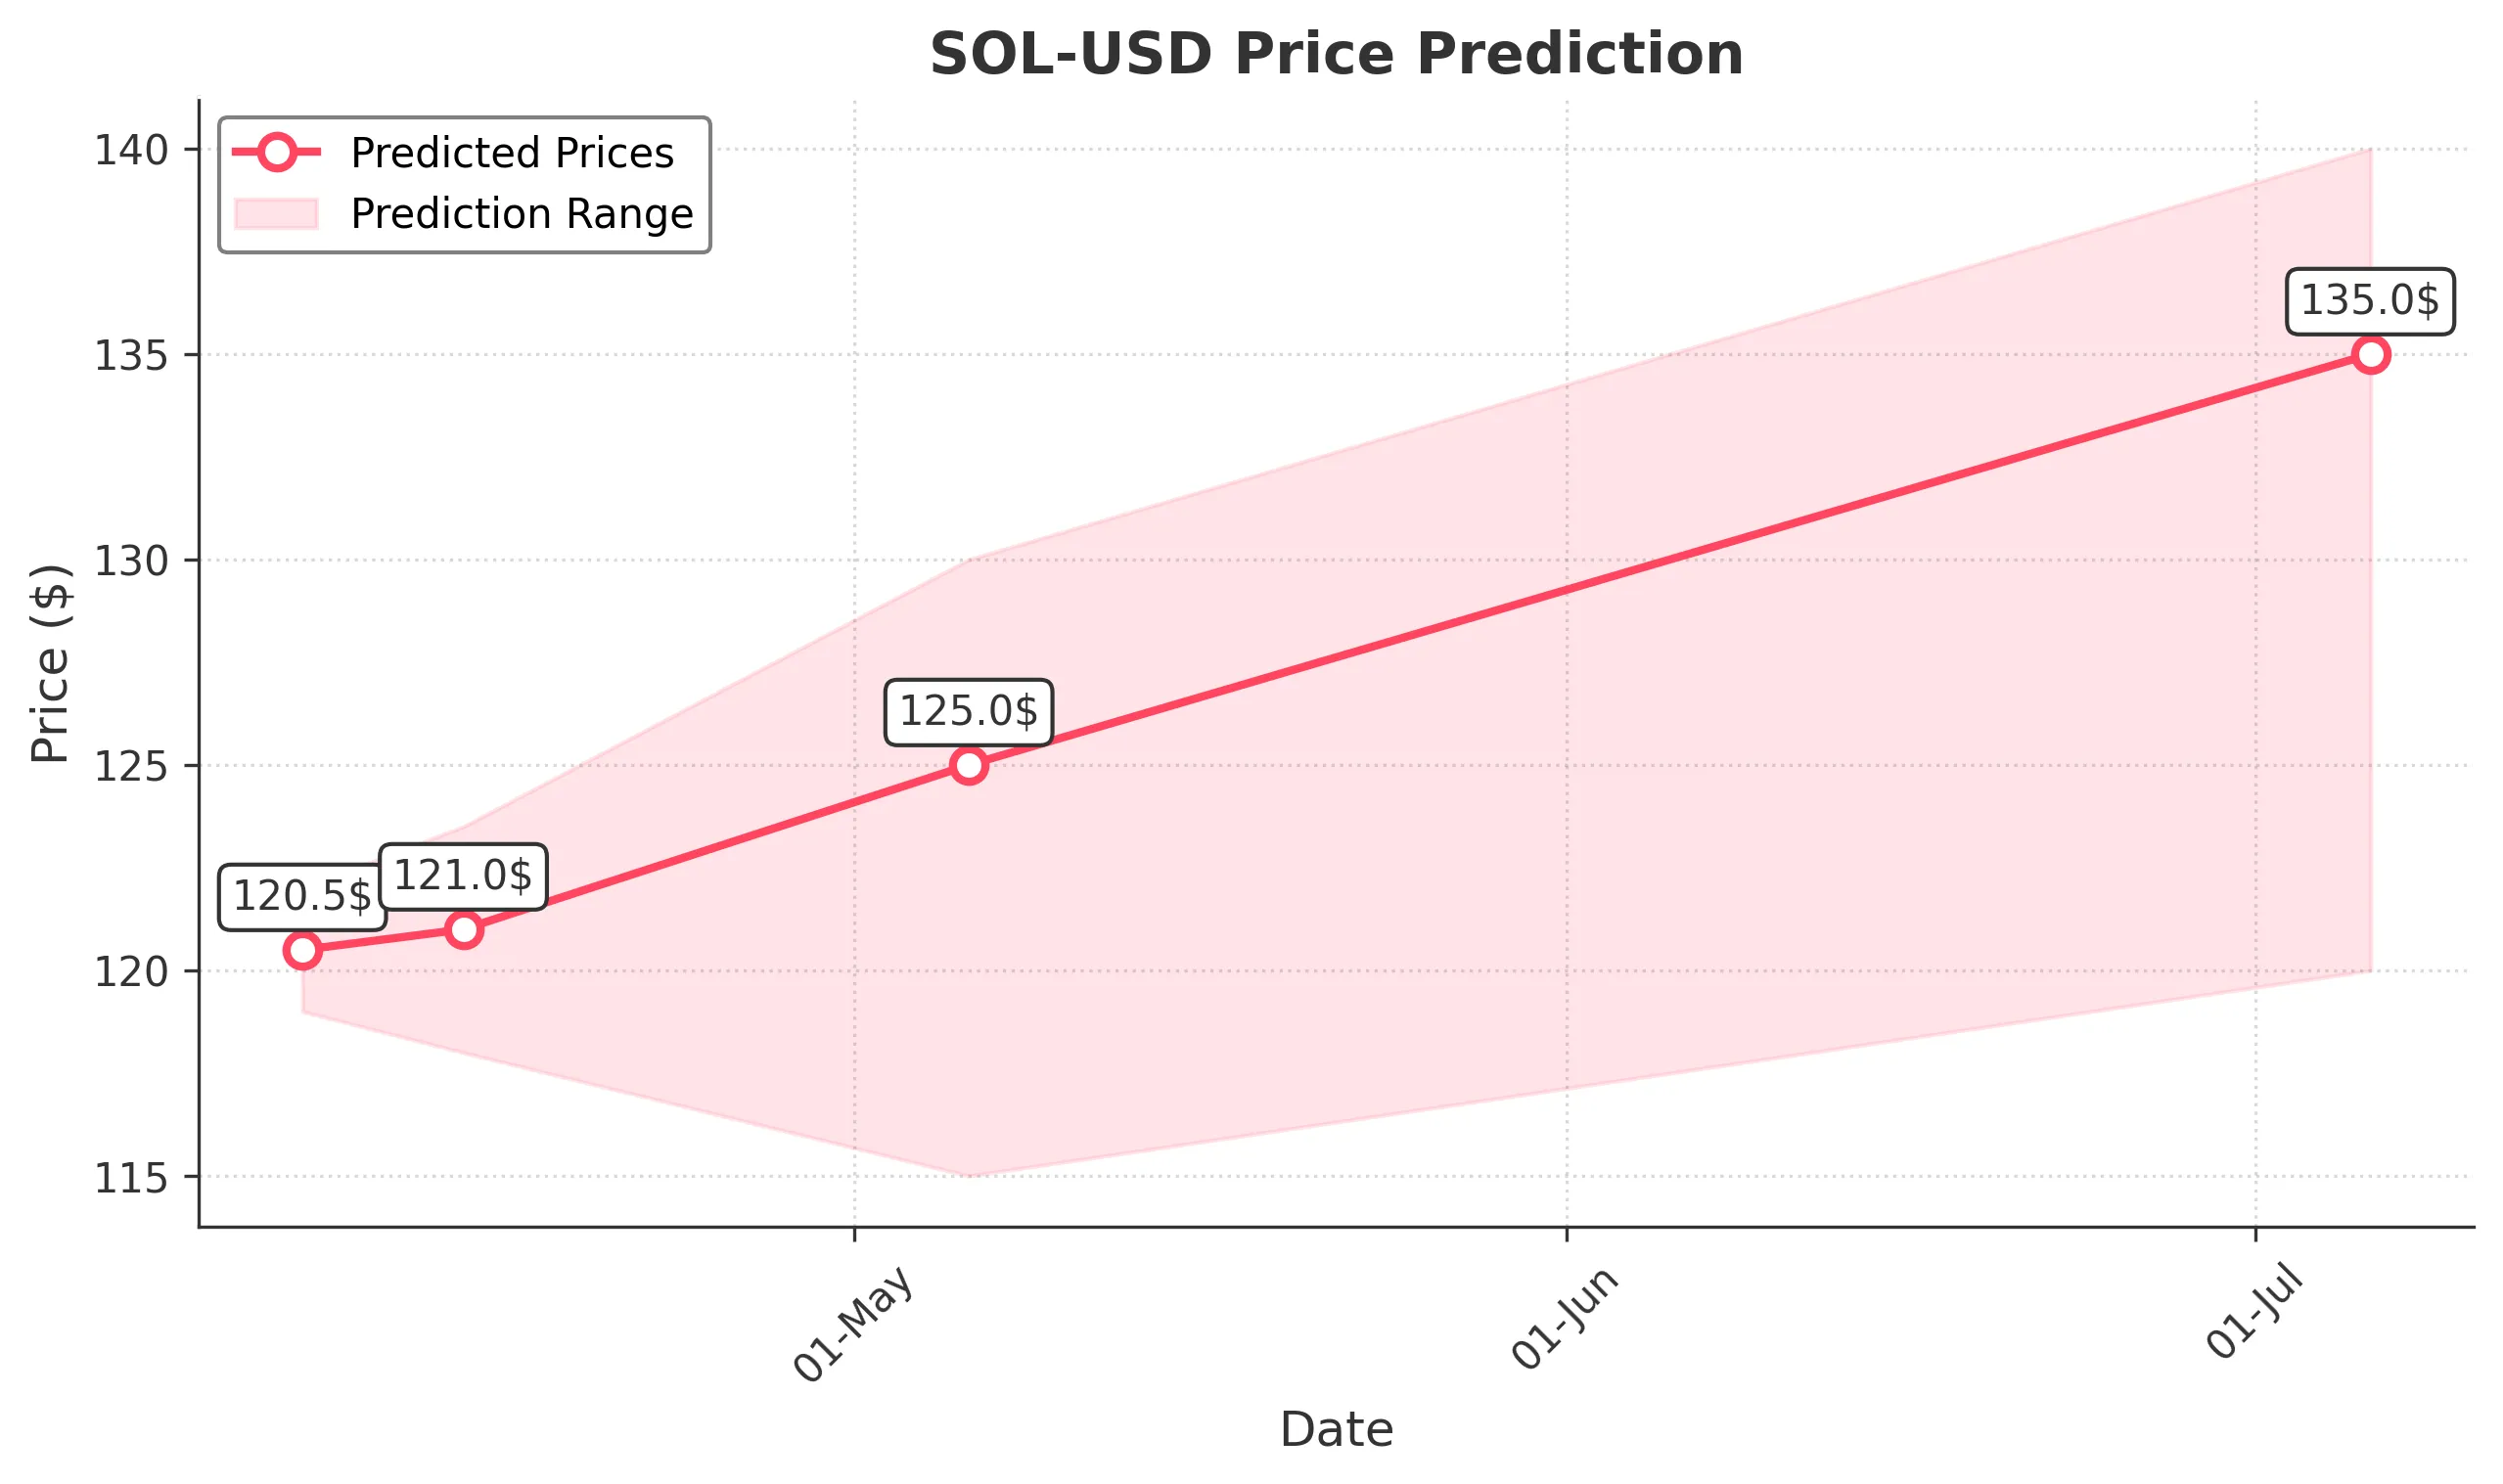
Target: April 7, 2025$120.5
$120.3
$122
$119
Description
The stock shows a slight bearish trend with recent lower highs and lower lows. RSI indicates oversold conditions, suggesting a potential bounce. However, MACD is bearish, indicating continued downward pressure. Volume remains low, indicating lack of strong buying interest.
Analysis
Over the past 3 months, SOL-USD has shown a bearish trend with significant price drops. Key support is around $117, while resistance is near $130. Volume spikes were noted during sell-offs, indicating strong selling pressure. Technical indicators suggest potential for a short-term bounce, but overall sentiment remains cautious.
Confidence Level
Potential Risks
Market volatility and external news could impact the price significantly.
1 Week Prediction
Target: April 14, 2025$121
$120.5
$123.5
$118
Description
A slight recovery is expected as the stock may find support at $119. The RSI is approaching neutral, indicating potential for upward movement. However, MACD remains bearish, suggesting caution. Volume may increase as traders react to price movements.
Analysis
The stock has been in a downtrend, with significant resistance at $130. Recent price action shows attempts to stabilize around $120. Technical indicators suggest a potential short-term recovery, but overall market sentiment remains bearish, with risks of further declines.
Confidence Level
Potential Risks
Unforeseen market events or news could lead to volatility, impacting the prediction.
1 Month Prediction
Target: May 6, 2025$125
$121
$130
$115
Description
Expect a gradual recovery as the stock may test resistance at $130. The RSI is improving, indicating potential bullish momentum. However, MACD remains bearish, suggesting caution. Volume may increase as traders react to price movements.
Analysis
The stock has shown a bearish trend, but recent price action suggests a potential bottoming out. Key support is at $115, while resistance is at $130. Technical indicators show mixed signals, indicating uncertainty in the market. A cautious approach is advised.
Confidence Level
Potential Risks
Market sentiment could shift quickly due to macroeconomic factors or news.
3 Months Prediction
Target: July 6, 2025$135
$125
$140
$120
Description
A potential recovery trend may emerge as the stock approaches key resistance levels. The RSI may indicate bullish momentum, but MACD remains a concern. Volume could increase as traders react to market conditions.
Analysis
The stock has been in a bearish trend, but signs of recovery may emerge. Key support is at $120, while resistance is at $140. Technical indicators show potential for upward movement, but overall market sentiment remains cautious. External factors could significantly impact price movements.
Confidence Level
Potential Risks
Long-term predictions are uncertain due to market volatility and external factors.