SOL-USD Trading Predictions
1 Day Prediction
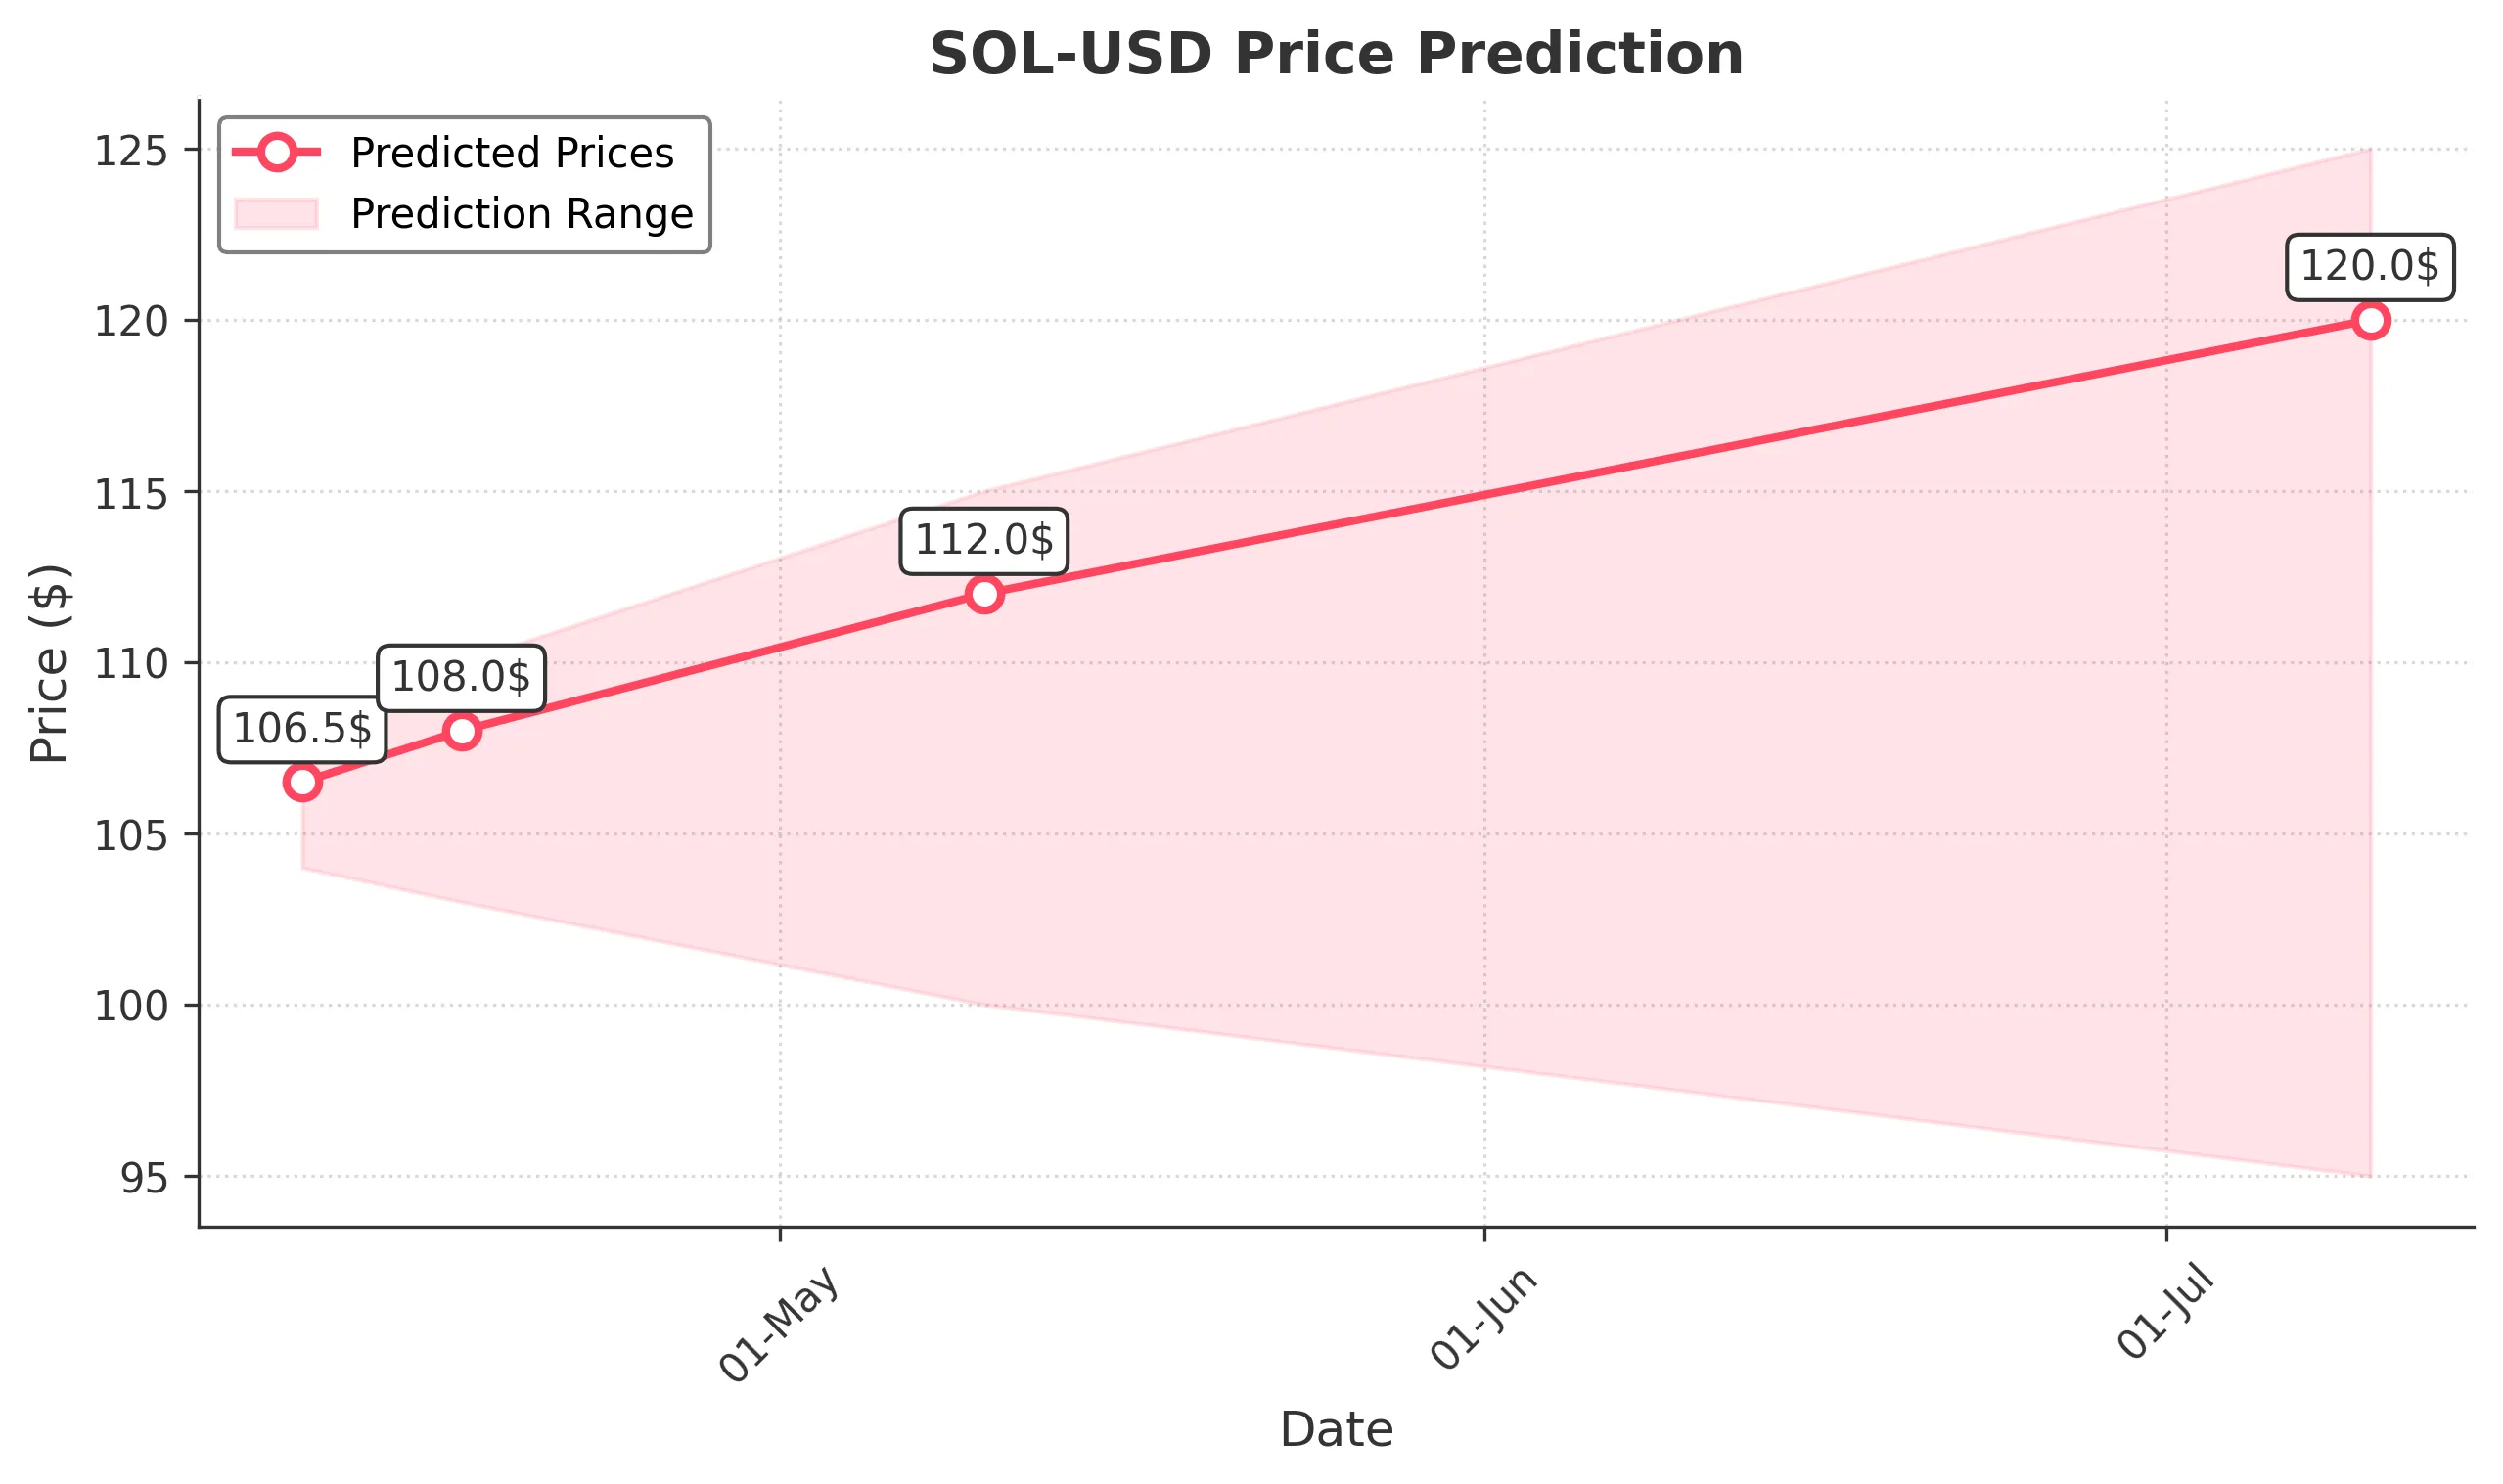
Target: April 10, 2025$106.5
$106
$108
$104
Description
The stock shows signs of consolidation around the 105-107 range. RSI indicates oversold conditions, suggesting a potential bounce. However, recent bearish sentiment and high volatility may limit upward movement.
Analysis
Over the past 3 months, SOL-USD has experienced significant volatility, with a bearish trend recently. Key support is around 105, while resistance is near 120. Volume spikes indicate strong selling pressure, and technical indicators suggest caution.
Confidence Level
Potential Risks
Market sentiment remains bearish, and any negative news could lead to further declines.
1 Week Prediction
Target: April 17, 2025$108
$106.5
$110
$103
Description
A slight recovery is expected as the stock may find support at 105. However, the overall bearish trend persists, and any upward movement could be limited by resistance at 110.
Analysis
The stock has been in a downtrend, with significant selling pressure. Key support at 105 is critical, while resistance at 110 may cap any potential rallies. Technical indicators show mixed signals, indicating uncertainty.
Confidence Level
Potential Risks
Continued bearish sentiment and macroeconomic factors could hinder recovery efforts.
1 Month Prediction
Target: May 10, 2025$112
$108
$115
$100
Description
A potential recovery could occur if the stock holds above 105. However, the overall trend remains bearish, and external factors could impact performance significantly.
Analysis
The stock has shown a bearish trend with high volatility. Support at 105 is crucial, while resistance at 115 may limit upward movement. Technical indicators suggest a cautious approach, with potential for recovery if conditions improve.
Confidence Level
Potential Risks
Market volatility and external economic conditions may lead to unexpected price movements.
3 Months Prediction
Target: July 10, 2025$120
$112
$125
$95
Description
If the stock can stabilize above 105, a gradual recovery towards 120 is possible. However, the bearish trend and market sentiment remain significant risks.
Analysis
The stock has faced significant downward pressure, with key support at 105. Resistance at 125 may limit upward movement. Technical indicators show bearish momentum, and external factors could heavily influence future performance.
Confidence Level
Potential Risks
Unforeseen macroeconomic events and continued bearish sentiment could lead to further declines.