SOL-USD Trading Predictions
1 Day Prediction
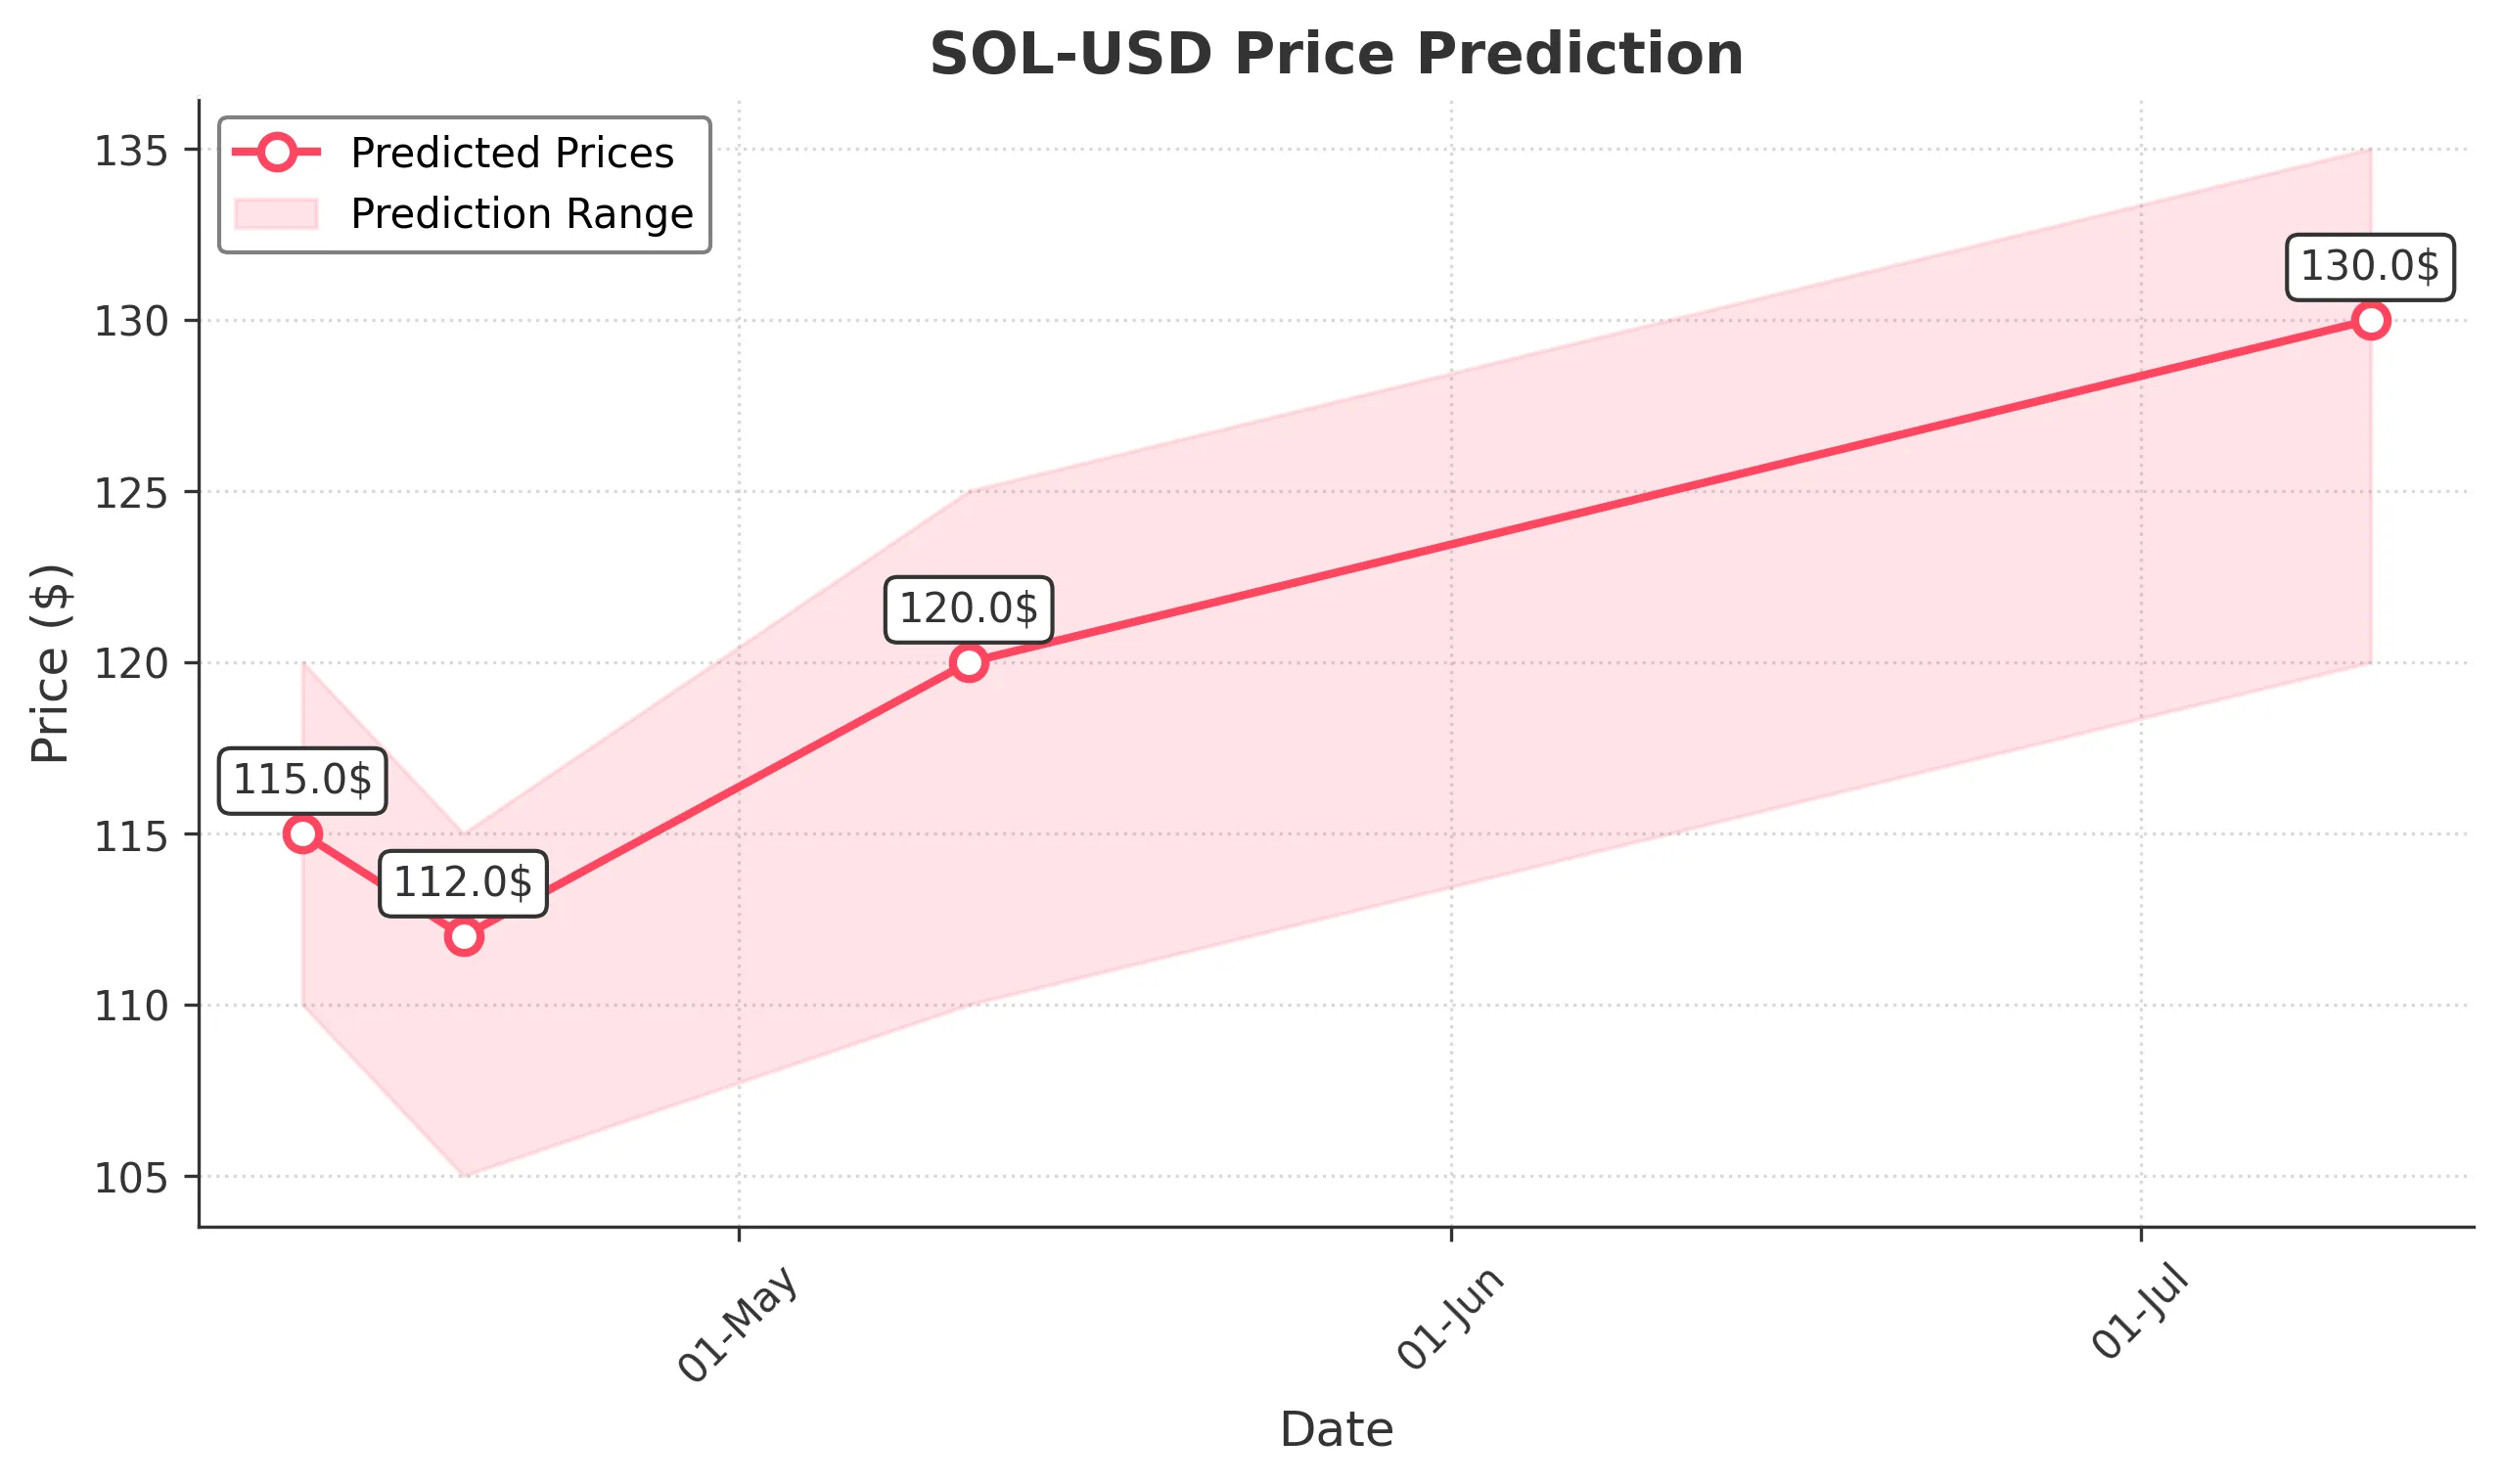
Target: April 12, 2025$115
$115.5
$120
$110
Description
The stock shows bearish momentum with a recent downtrend. RSI indicates oversold conditions, but MACD suggests potential for a slight rebound. Expect volatility due to recent trading volume spikes.
Analysis
Over the past 3 months, SOL-USD has experienced significant volatility, with a bearish trend recently. Key support at $105 and resistance at $130. Volume spikes indicate potential reversals, but overall sentiment remains cautious.
Confidence Level
Potential Risks
Market sentiment is uncertain, and external news could impact price movements significantly.
1 Week Prediction
Target: April 19, 2025$112
$110.5
$115
$105
Description
Continued bearish pressure is expected, with potential for a slight recovery. The stock remains below key moving averages, and volume analysis shows selling pressure. Watch for any bullish reversal patterns.
Analysis
The stock has been in a downtrend, with significant resistance at $120. Recent candlestick patterns suggest indecision, and the overall market sentiment is bearish. Key support levels are being tested.
Confidence Level
Potential Risks
Unforeseen macroeconomic events could lead to increased volatility and impact the prediction.
1 Month Prediction
Target: May 11, 2025$120
$115
$125
$110
Description
A potential recovery could occur as the stock approaches key support levels. RSI may indicate a reversal, but caution is advised due to overall market conditions. Watch for bullish patterns.
Analysis
The stock has shown signs of consolidation around $110-$120. Technical indicators suggest potential for a rebound, but bearish sentiment persists. Volume patterns indicate uncertainty, and macroeconomic factors could influence price.
Confidence Level
Potential Risks
Market volatility and external factors could hinder recovery efforts, leading to further declines.
3 Months Prediction
Target: July 11, 2025$130
$125
$135
$120
Description
If the market stabilizes, a gradual recovery could push prices higher. Key resistance at $135 may be tested. Watch for bullish signals in technical indicators and volume trends.
Analysis
The stock has been volatile, with a bearish trend recently. However, if support holds, there may be a chance for recovery. Key resistance levels will be critical in determining future price movements.
Confidence Level
Potential Risks
Long-term predictions are uncertain due to potential market shifts and economic conditions.