SOL-USD Trading Predictions
1 Day Prediction
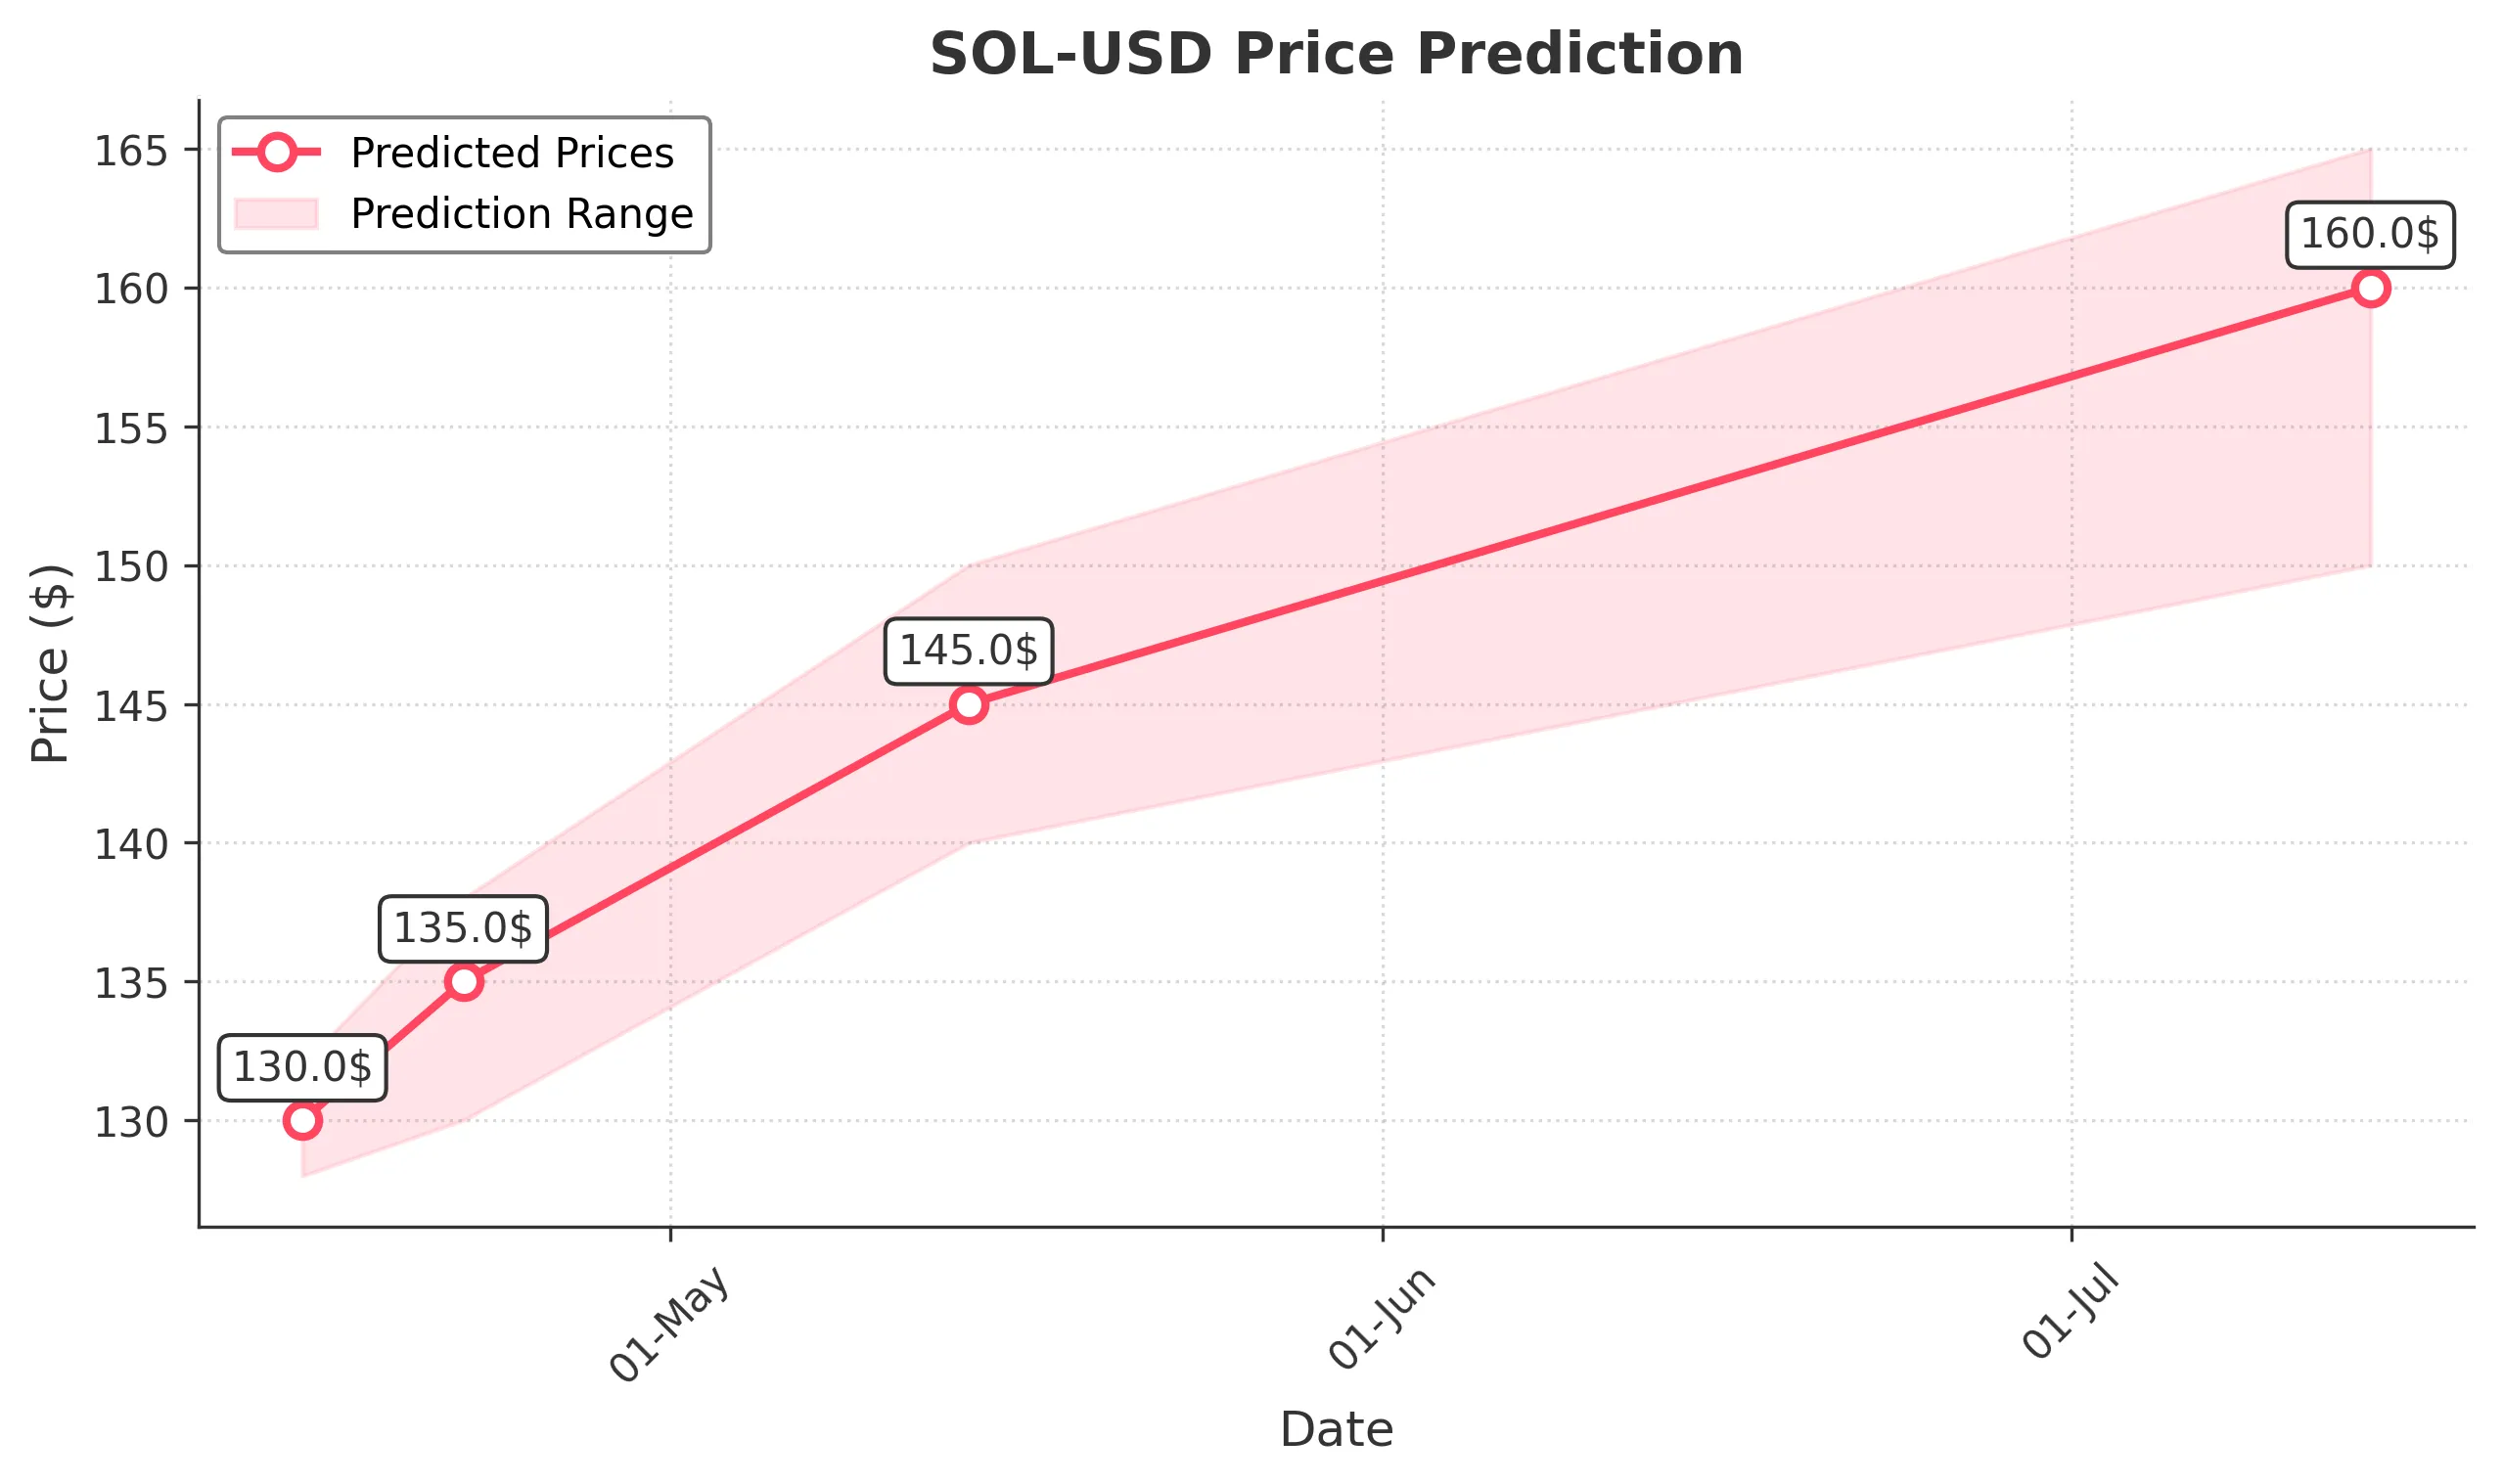
Target: April 15, 2025$130
$130
$132
$128
Description
The stock shows a slight bullish trend with a recent Doji pattern indicating indecision. The RSI is near 50, suggesting a potential reversal. Volume remains stable, but external market sentiment could impact performance.
Analysis
Over the past 3 months, SOL-USD has experienced significant volatility, with a peak around late January. The stock has shown bearish tendencies recently, with support at 120 and resistance at 140. Technical indicators suggest a potential rebound, but caution is advised.
Confidence Level
Potential Risks
Market volatility and external news could lead to unexpected price movements.
1 Week Prediction
Target: April 22, 2025$135
$134
$138
$130
Description
A bullish engulfing pattern suggests a potential upward trend. The MACD is showing a bullish crossover, and the RSI is moving towards overbought territory. Volume is expected to increase as traders react to market sentiment.
Analysis
The stock has shown recovery signs after a bearish phase, with key support at 120. The recent price action indicates a potential upward trend, but external factors like market sentiment and economic news could influence the direction.
Confidence Level
Potential Risks
If macroeconomic factors shift negatively, it could reverse the bullish trend.
1 Month Prediction
Target: May 14, 2025$145
$144
$150
$140
Description
The stock is expected to continue its upward trajectory, supported by bullish technical indicators. The Fibonacci retracement levels suggest a target around 145, with increasing volume indicating strong buying interest.
Analysis
SOL-USD has shown resilience with a recent bullish trend. Key resistance levels are being tested, and the stock's performance is influenced by overall market conditions. The technical indicators suggest a cautious bullish outlook.
Confidence Level
Potential Risks
Potential market corrections or negative news could impact the price.
3 Months Prediction
Target: July 14, 2025$160
$158
$165
$150
Description
Long-term indicators suggest a bullish trend, with the stock potentially breaking through resistance levels. The MACD and RSI indicate strong momentum, but market volatility remains a concern.
Analysis
The stock has shown a recovery pattern, with significant support at 140. The overall trend appears bullish, but external factors such as economic conditions and market sentiment could lead to volatility. Caution is advised for long-term positions.
Confidence Level
Potential Risks
Long-term predictions are subject to market fluctuations and economic changes.