SOL-USD Trading Predictions
1 Day Prediction
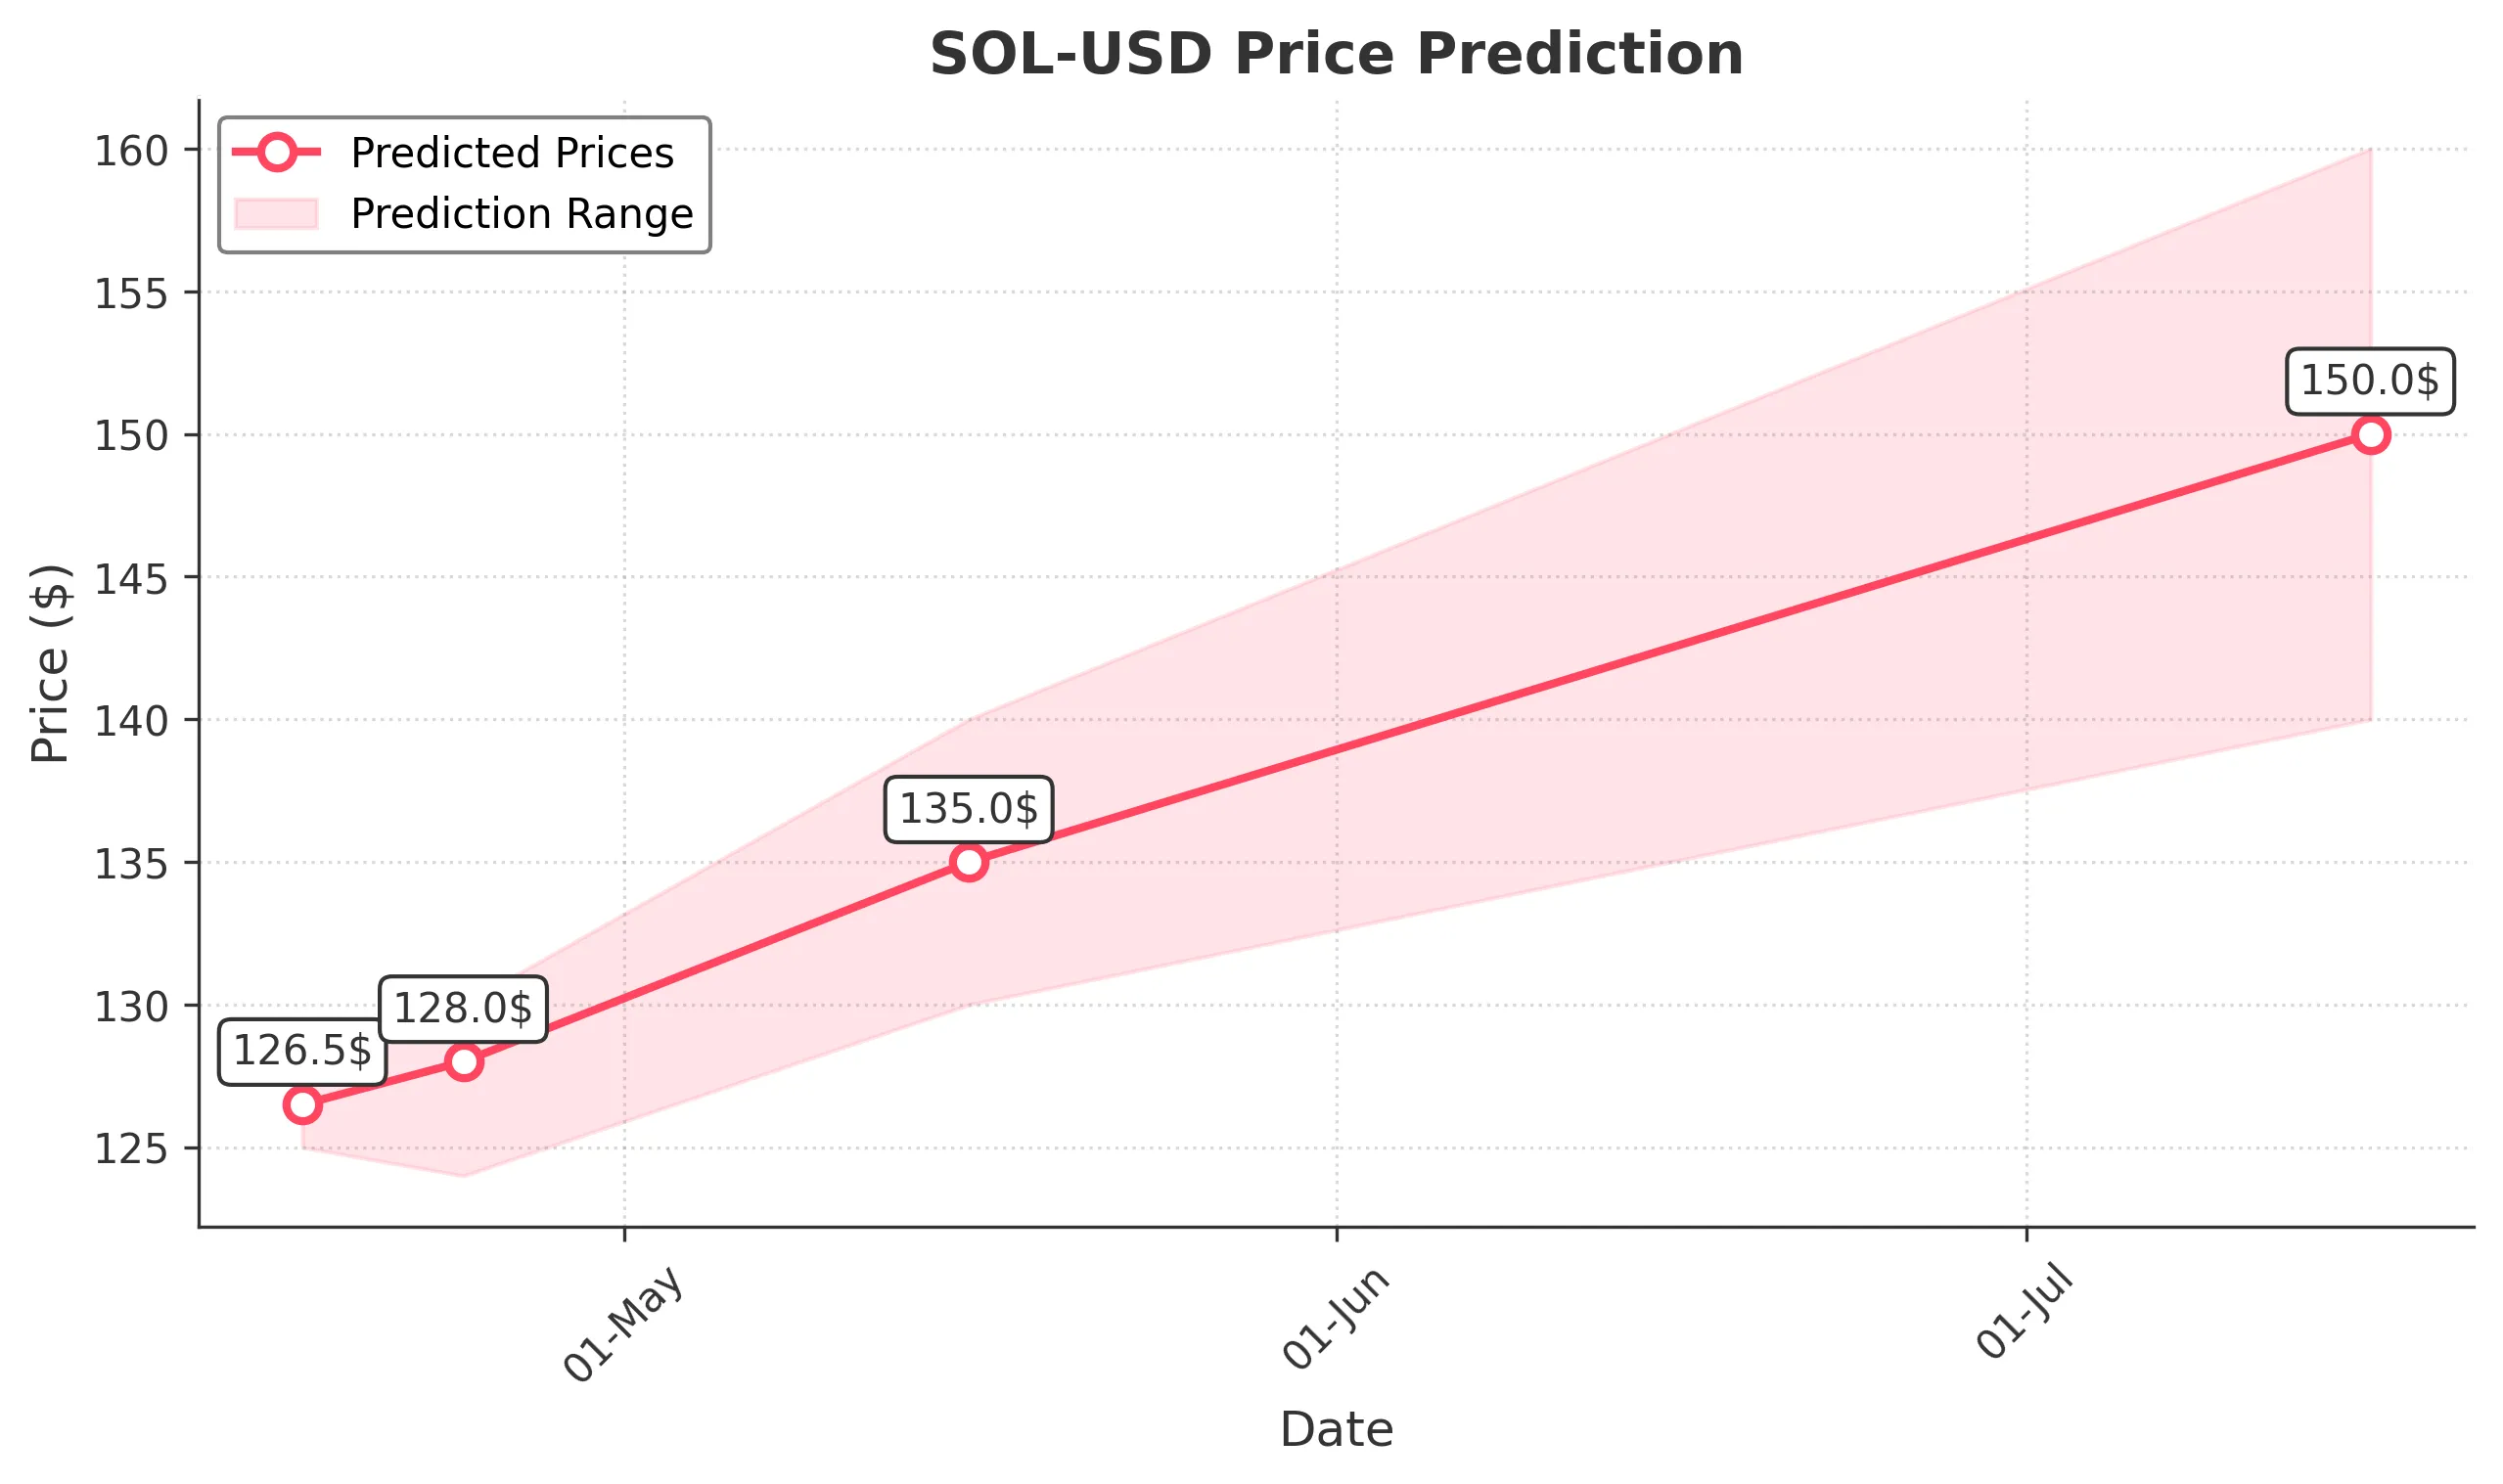
Target: April 17, 2025$126.5
$126.3
$128
$125
Description
The stock shows signs of stabilization after recent volatility. The RSI is neutral, and MACD indicates a potential bullish crossover. However, recent bearish candlestick patterns suggest caution. Volume remains moderate, indicating a lack of strong conviction.
Analysis
Over the past 3 months, SOL-USD has experienced significant volatility, with a bearish trend recently. Key support is around 125, while resistance is near 130. The RSI indicates potential oversold conditions, but the MACD shows mixed signals. Volume spikes were noted during price drops, indicating selling pressure.
Confidence Level
Potential Risks
Market sentiment could shift quickly due to macroeconomic news or earnings reports, which may impact the prediction.
1 Week Prediction
Target: April 24, 2025$128
$126.5
$130
$124
Description
The stock may recover slightly as it approaches key support levels. The Bollinger Bands suggest a potential breakout, while the MACD is showing signs of bullish momentum. However, the overall market sentiment remains cautious.
Analysis
The stock has been in a bearish phase, with recent attempts to stabilize. Key support at 125 has held, but resistance at 130 remains a challenge. The RSI is approaching oversold territory, indicating potential for a bounce. Volume patterns suggest cautious trading.
Confidence Level
Potential Risks
Unforeseen market events or negative news could reverse the trend, impacting the prediction's accuracy.
1 Month Prediction
Target: May 16, 2025$135
$128
$140
$130
Description
A gradual recovery is anticipated as the stock finds support. The MACD may confirm a bullish trend, and the RSI could improve. However, external factors like economic data releases could influence market sentiment.
Analysis
The stock has shown a bearish trend recently, but signs of recovery are emerging. Key resistance at 140 may pose challenges. The RSI is improving, and the MACD is turning bullish. Volume remains moderate, indicating cautious optimism among traders.
Confidence Level
Potential Risks
Economic indicators or geopolitical events could lead to volatility, affecting the stock's performance.
3 Months Prediction
Target: July 16, 2025$150
$135
$160
$140
Description
Long-term recovery is expected as market conditions stabilize. The stock may break through resistance levels, supported by positive market sentiment and improved fundamentals. However, macroeconomic factors could still pose risks.
Analysis
The stock has been volatile, with a recent bearish trend. However, potential for recovery exists if key resistance levels are broken. The RSI and MACD suggest improving momentum, but external factors could impact performance. Volume patterns indicate cautious trading.
Confidence Level
Potential Risks
Long-term predictions are inherently uncertain due to potential market shifts and economic changes.