SOL-USD Trading Predictions
1 Day Prediction
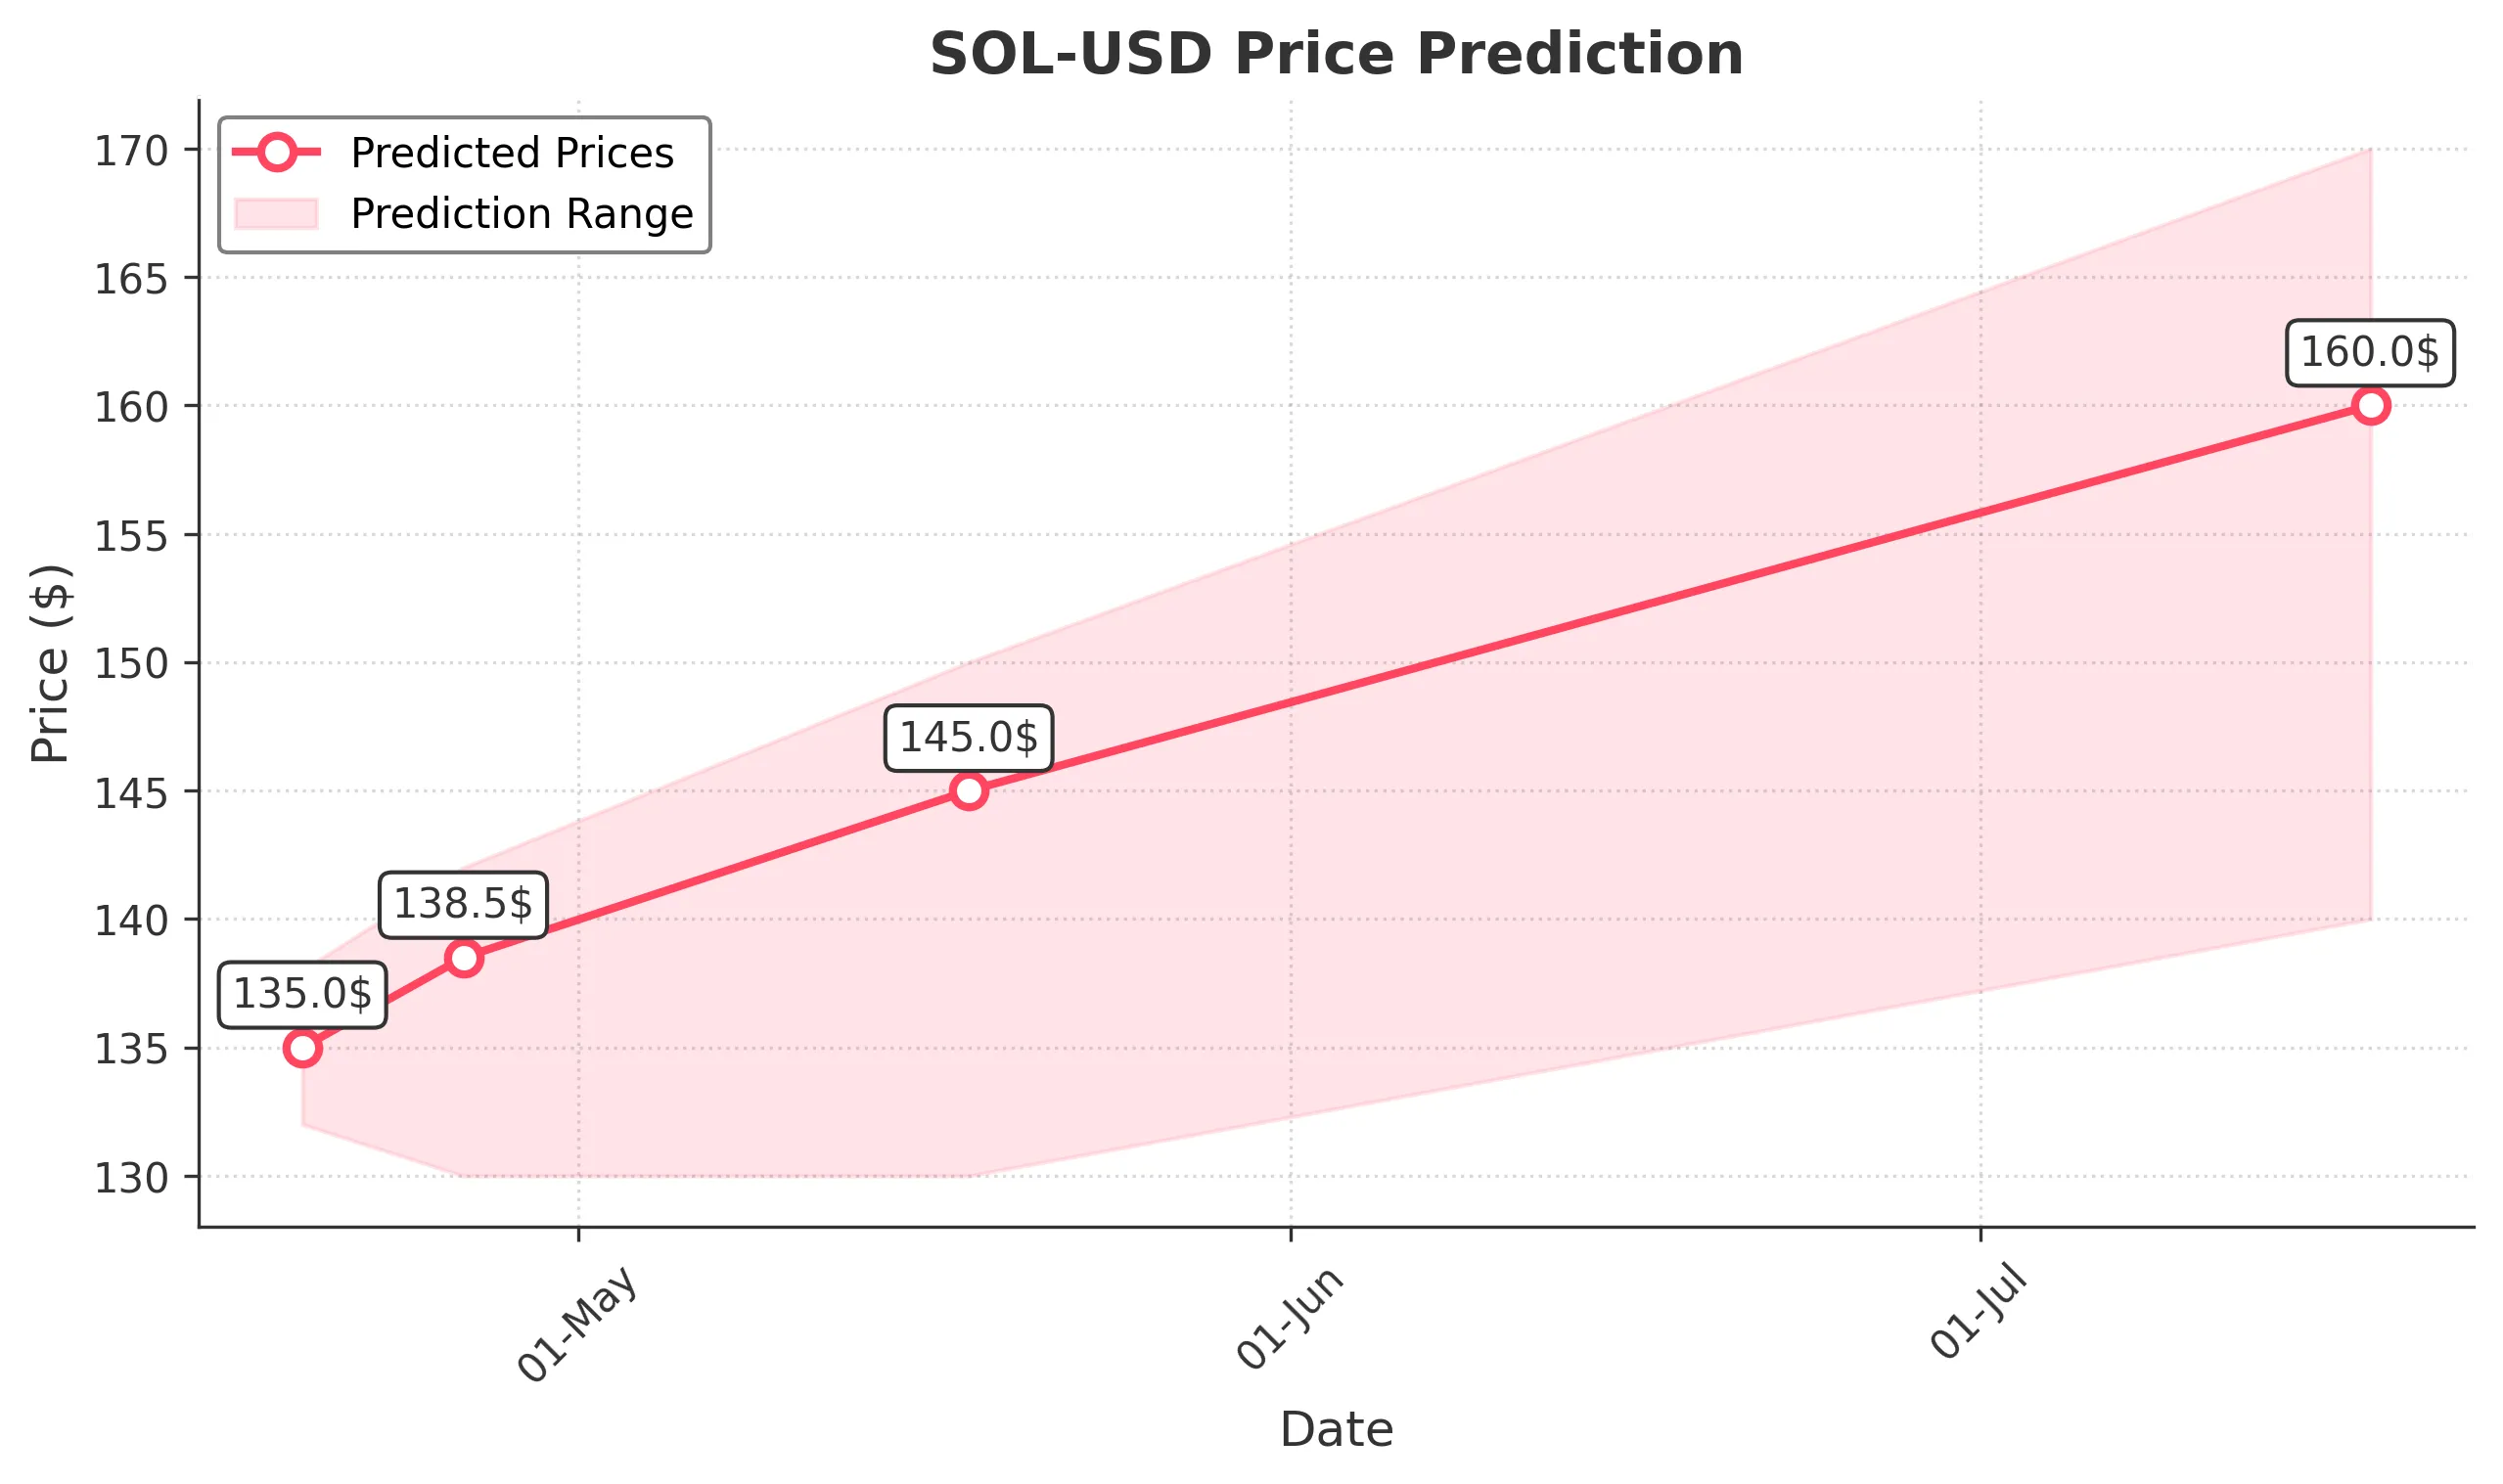
Target: April 19, 2025$135
$134.5
$138
$132
Description
The stock shows a slight bullish trend with a potential bounce from recent support levels. RSI indicates oversold conditions, suggesting a possible short-term recovery. However, volatility remains high, and market sentiment is cautious.
Analysis
Over the past 3 months, SOL-USD has experienced significant volatility, with a bearish trend recently. Key support is around 130, while resistance is near 140. Technical indicators show mixed signals, with RSI suggesting oversold conditions, but MACD indicates potential bearish momentum.
Confidence Level
Potential Risks
Market volatility and external news could impact the prediction. A sudden downturn is possible if bearish sentiment prevails.
1 Week Prediction
Target: April 26, 2025$138.5
$135
$142
$130
Description
A potential recovery is anticipated as the stock may find support at lower levels. The MACD shows signs of convergence, indicating a possible bullish reversal. However, external factors could still lead to fluctuations.
Analysis
The stock has been in a bearish phase, with recent lows indicating a struggle to maintain upward momentum. Key support at 130 is critical, while resistance at 140 may limit gains. Volume patterns suggest cautious trading, with potential for recovery if sentiment improves.
Confidence Level
Potential Risks
Unforeseen market events or negative news could reverse the trend. The overall market sentiment remains fragile.
1 Month Prediction
Target: May 18, 2025$145
$138
$150
$130
Description
If the bullish trend continues, the stock could reach higher levels, supported by improved market sentiment. However, resistance at 150 may pose challenges. Watch for volume spikes indicating strong buying interest.
Analysis
The stock has shown a bearish trend recently, with significant fluctuations. Key support at 130 and resistance at 150 are critical levels. Technical indicators suggest a potential reversal, but overall market sentiment remains uncertain, with external factors influencing price movements.
Confidence Level
Potential Risks
Market conditions are unpredictable, and any negative news could derail the recovery. The potential for further declines remains.
3 Months Prediction
Target: July 18, 2025$160
$150
$170
$140
Description
If the market stabilizes and sentiment improves, the stock could see a gradual recovery towards 160. However, resistance at 170 may limit upward movement. Monitor for any changes in macroeconomic conditions.
Analysis
The stock has faced significant challenges over the past months, with a bearish trend dominating. Key support at 130 and resistance at 170 are crucial. Technical indicators show mixed signals, and external economic conditions could heavily influence future performance.
Confidence Level
Potential Risks
Long-term predictions are highly uncertain due to potential market volatility and external economic factors. A bearish reversal is still a possibility.